
Unit 6 Test: Lessons 45–56 Solutions
| # | Answer | Lesson Origin |
| 1) | C | 45 |
| 2) | D | 48 |
| 3) | B | 55 |
| 4) | D | 52 |
| 5) | C | 45 |
| 6) | D | 53 |
| 7) | A | 49 |
| 8) | B | 56 |
| 9) | A | 54 |
| 10) | B | 46 |
| 11) | B | 48 |
| 12) | C | 51 |
| 13) | B | 56 |
| 14) | D | 52 |
| 15) | C | 50 |
| 16) | A | 46 |
| 17) | C | 50 |
| 18) | A | 54 |
| 19) | A | 47 |
| 20) | D | 51 |
| 21) | B | 53 |
| 22) | D | 49 |
| 23) | C | 47 |
| 24) | A | 46 |
| 25) | D | 55 |
C
- Determine the type of distribution for the data set:
-
Left-skewed
-
Symmetric
-
Right-skewed
-
Cannot be determined
Note
- The mean is less than the median for left-skewed distributions.
- The mean and median are equal for symmetric distributions.
D
- Callie’s Coffee is a drive-thru store. They decide to survey every tenth customer about their ordering experience. Identify the type of sampling method used.
-
Cluster sampling
-
Simple random sampling
-
Stratified sampling
-
Systematic sampling
Systematic: After the population is randomized to avoid bias, a starting point is determined from the population, and then every individual is selected.
Note
The scenario does not reflect the other types of sampling.
B
- A coin is flipped four times. What is the probability of the coin landing heads up exactly two times?
Note
- This option is the probability of one coin landing heads up.
- This option is the probability of two coins landing heads up.
- This option is the probability of any combination of four coins being flipped.
D
- What expression represents the sum of the 49th row of Pascal’s Triangle?
-
49!
-
The sum of n-rows of Pascal’s Triangle is
Note
- This option is .
- This option is n!.
- This option does not result in a value.
C
- Heights of privacy hedges are normally distributed and grown to an average height of 65 inches with a standard deviation of 3 inches. What is the range that includes 95% of the heights of the privacy hedges?
-
62 to 68 inches
-
56 to 74 inches
-
59 to 71 inches
-
62 to 71 inches
Note
- This option is one standard deviation.
- This option is three standard deviations.
- This option is one standard deviation below and two standard deviations above the mean.
D
- A bag contains four red, three yellow, and five green marbles. What is the probability of selecting a marble that is not yellow?
Note
- This option is the probability of selecting a red marble.
- This option is the probability of selecting a yellow marble.
- This option is the probability of selecting a green marble.
A
- A survey of 225 community members has a sample standard deviation of 5.1 percentage points. Determine the maximum error of the estimate for a 90% confidence level.
-
0.56
-
0.67
-
0.88
-
1.65
Note
- This option is the value for a 95% confidence level.
- This option is the value for a 99% confidence level.
- This option is the rounded value of the z-score.
B
- What does mean when working with conditional probabilities?
-
The probability of A given B occurred.
-
The probability of B given A occurred.
-
The probability of A and B occurred.
-
The probability of A or B occurred.
Note
- This option is .
- This option is .
- This option is .
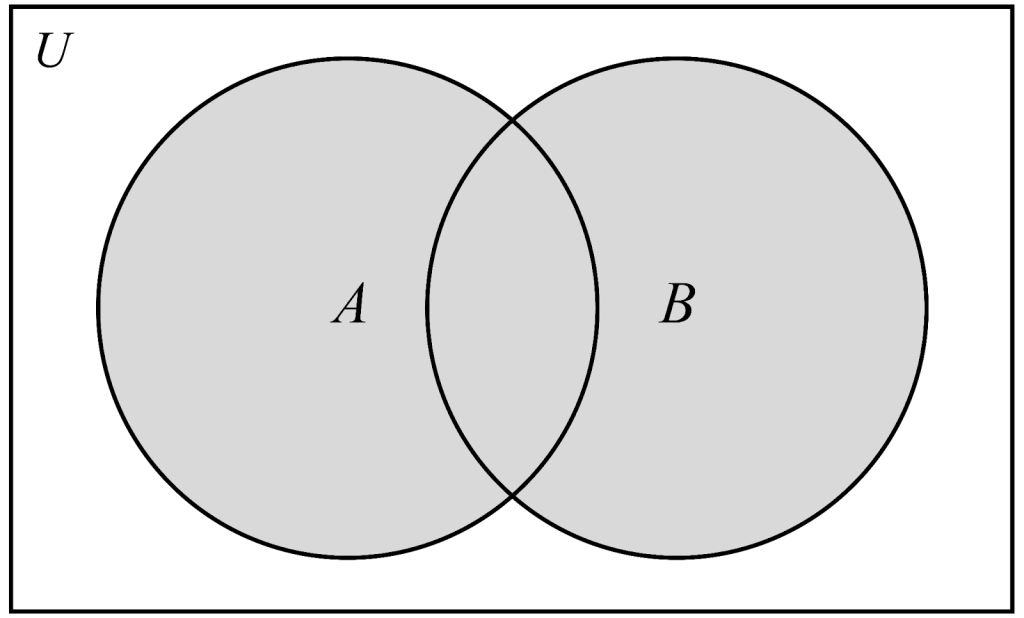
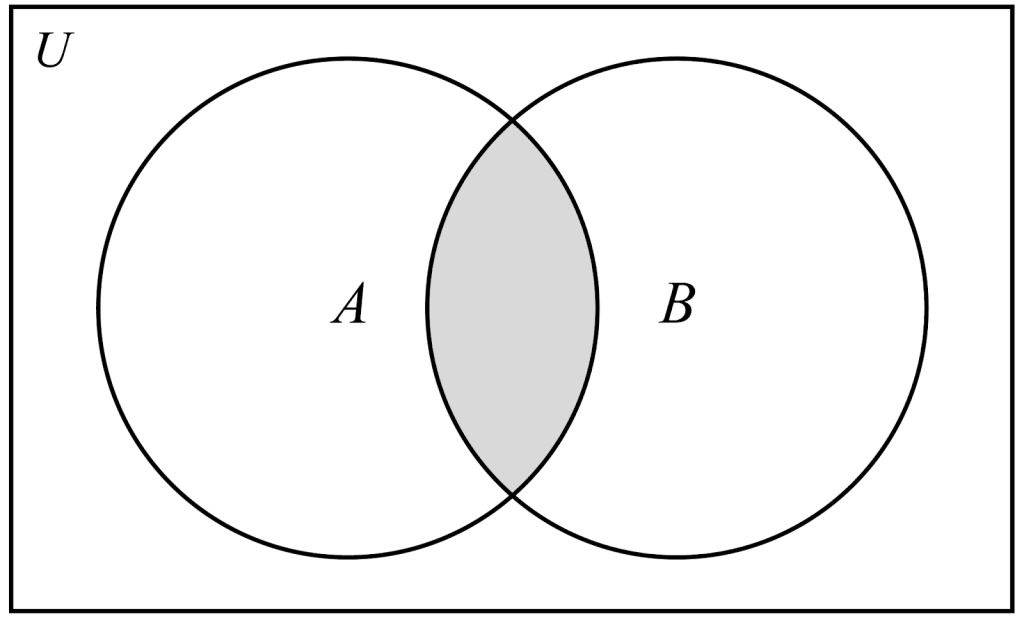
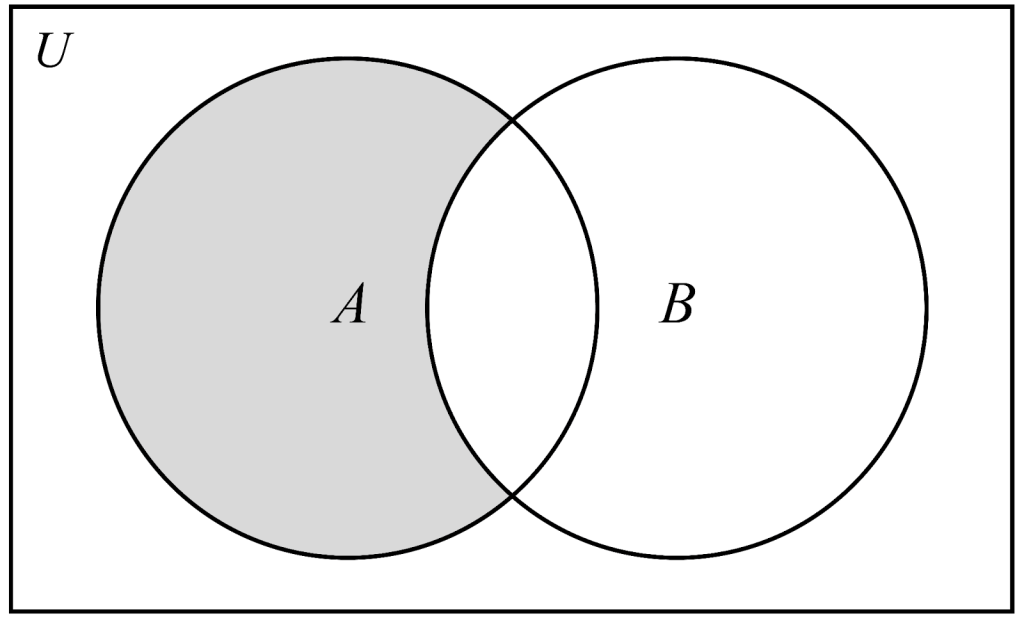
A
- Which diagram represents
-
-
-
-
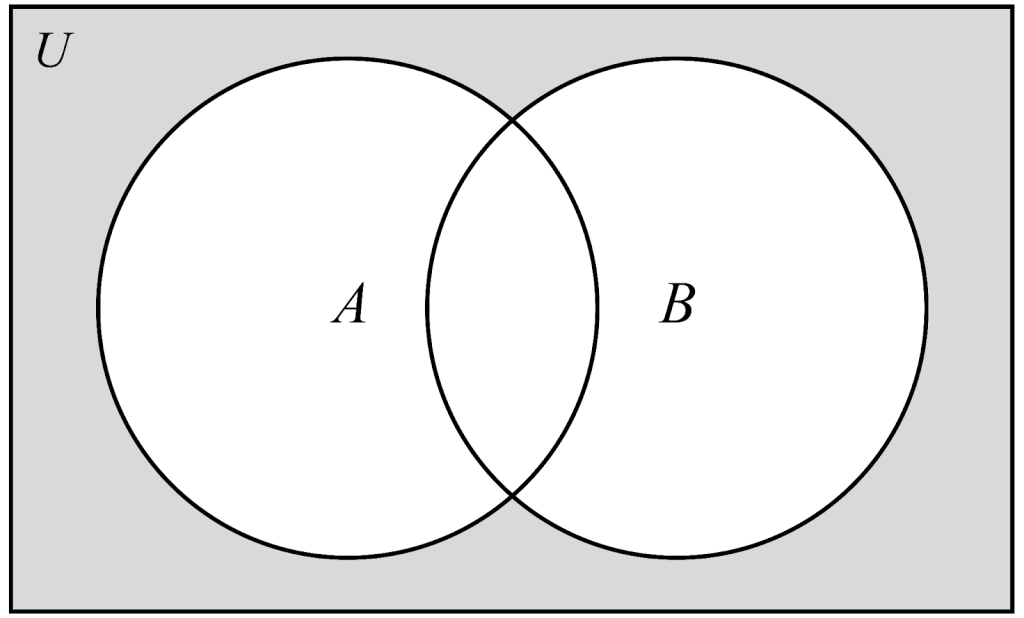
A or B means all the information is included in either set A or set B.
Note
- This option is .
- This option is .
- This option is .
B
- Mr. Boone noticed the final exam for his class was normally distributed with an average of 82% and a standard deviation of 5 percentage points. What is the approximate likelihood that a student scored higher than 91%?
-
1.8%
-
3.6%
-
87%
-
96.4%
Note
- This option is the z-score instead of the z-table value.
- This option is one standard deviation from the mean.
- This option is the likelihood that a student scores lower than 91%.
B
- What is the main problem with a clothing store only surveying the first ten customers that entered the store on a single day?
-
The population is unknown.
-
The sample is too small.
-
The sample is too large.
-
The sample is not random.
Small Sample: The sample is too small to draw any valid conclusions about the population
C
- Judges ranked seven auditioning violinists for the Town Symphony’s first- and second-chair violin seats. How many possible ways could the judges rank the violinists first and second choice?
-
14
-
21
-
42
-
49
Note
- This option is the product of seven and two.
- This option is the answer if the problem was a combination.
- This option is seven-squared.
B
- Fitness-4-All Gym documented that 70% of members use the cardio machines and 50% lift weights. If what is
-
0.80
-
0.56
-
0.40
-
0.35
Note
- This option is the conditional probability.
- This option is the product of 0.8 and 0.5.
- This option is the product of 0.7 and 0.5.
D
- Determine the coefficient of the middle term when the binomial is expanded.
-
4
-
6
-
9
-
54
Note
- This option is the exponent and row.
- This option is the coefficient ignoring the term 3x.
- This option is .
C
- Athletes were divided into two groups to determine if breathing exercises improved performance on game days. After a simulation of 10,000 trials, the standard deviation was 1.5 percentage points. Determine the z-score for the observed difference at the 95% level.
-
1.50
-
1.96
-
2.67
-
3.40
|
Group |
Average Performance |
|
Treatment: added breathing exercises |
72.2% |
|
Control: no breathing exercises |
68.8% |
Note
- This option is the standard deviation.
- This option is the z-score for a 95% confidence level.
- This option is the observed difference of the means.
A
- A normal data distribution has a mean of 100 and a standard deviation of 15. What approximate percentage of data falls below 87?
-
19%
-
34%
-
68%
-
81%
Note
- This option is the percentage between the mean and one standard deviation above the mean.
- This option is the percentage within one standard deviation of the mean.
- This option is the percentage if the negative symbol of the z-score is ignored.
C
- A researcher calculated the z-score of the observed difference between treatment and control groups to be 0.34. What can the researcher conclude?
-
The treatment is highly effective.
-
A larger experiment should be conducted.
-
The results are not statistically significant.
-
The results are statistically significant.
The closer the z-score is to zero, the less statistically significant it is.
Note
A, D) A highly effective treatment would have a z-score > 1.96.
- This option cannot be determined from the information.
A
- From a standard deck of cards, determine P(king or heart).
Note
- This option is the probability if the king of hearts is double-counted.
- This option is the probability if all the fractions are added together.
- This option is the probability of selecting a card with hearts.
A
- A scientist collects 200 crayfish from Lake Luna containing 10,000 crayfish. Name the sample.
-
The 200 crayfish collected.
-
All crayfish in Lake Luna.
-
All crayfish in all lakes.
-
There is no sample named.
Sample: A subset (or part) of a population from which data is collected.
Note
- This option is the population of crayfish in Lake Luna.
- This option is the world population of crayfish.
D
- A restaurant designed a new menu with eight appetizers, six salads, and twelve entrees. How many unique meals can be created when one option from each part of the menu is selected?
-
26
-
72
-
96
-
576
Note
- This option is the sum of the options.
- This option is the total number of options without selecting an appetizer.
- This option is the total number of options without selecting a salad.
B
- If an experiment runs 200 times with a theoretical probability of 0.25, how many successes can you expect?
-
25
-
50
-
100
-
200
Note
- This option would be the number of successes for 100 trials.
- This option would be the number of successes if the probability is 0.5.
- This option is the number of trials in the experiment.
D
- A consumer group randomly selected 150 customers to complete a survey. If 9% of customers reported being dissatisfied with a margin of error equal to ±7%, what interval contains the population parameter for satisfied customers?
-
Between 2% and 16% of customers will be satisfied.
-
Between 91% and 98% of customers will be satisfied.
-
Between 84% and 91% of customers will be satisfied.
-
Between 84% and 98% of customers will be satisfied.
Note
- This option is the range of dissatisfied customers.
B, C) This option is only half of the margin of error.
C
- A researcher surveys and records the species of birds people have seen when visiting a park. What type of study is this?
-
Experiment
-
Observation
-
Survey
-
Census
Sample Survey: Through researcher questionnaires or interviews, conclusions are drawn about the population using the sample.
Note
The scenario does not reflect the other types of studies.
A
- In a standard normal distribution, approximately what proportion of data falls between and
-
0.38
-
0.46
-
0.68
-
0.84
Note
- This option is the z-score for
- This option is the proportion within one standard deviation.
- This option is the z-score for 1.
D
- A six-sided number cube is rolled twice. What is the probability that the first number rolled is even, and the next number is less than three?
Note
- This option is the probability if you add the fractions.
- This option is the probability of rolling an even number.
- This option is the probability of rolling a number less than three.