Practice Solutions
Determine if the data is quantitative or categorical.
- Arrow Academy offers apparel for purchase: t-shirts, long-sleeved shirts, sweat shirts, and hoodies. They surveyed the first 100 people that came to the store to see which kind of apparel was their favorite.
Categorical
- Tami’s Trees and Shrubs asked customers to rate their satisfaction: very dissatisfied, dissatisfied, neutral, satisfied, very satisfied.
Categorical
- The annual “Beat the Heat 5K” listed the age of each racer.
Quantitative
- The annual “Beat the Heat 5K” gave medals for racers finishing first, second and third in each age range.
Categorical
Construct a histogram using the given intervals.
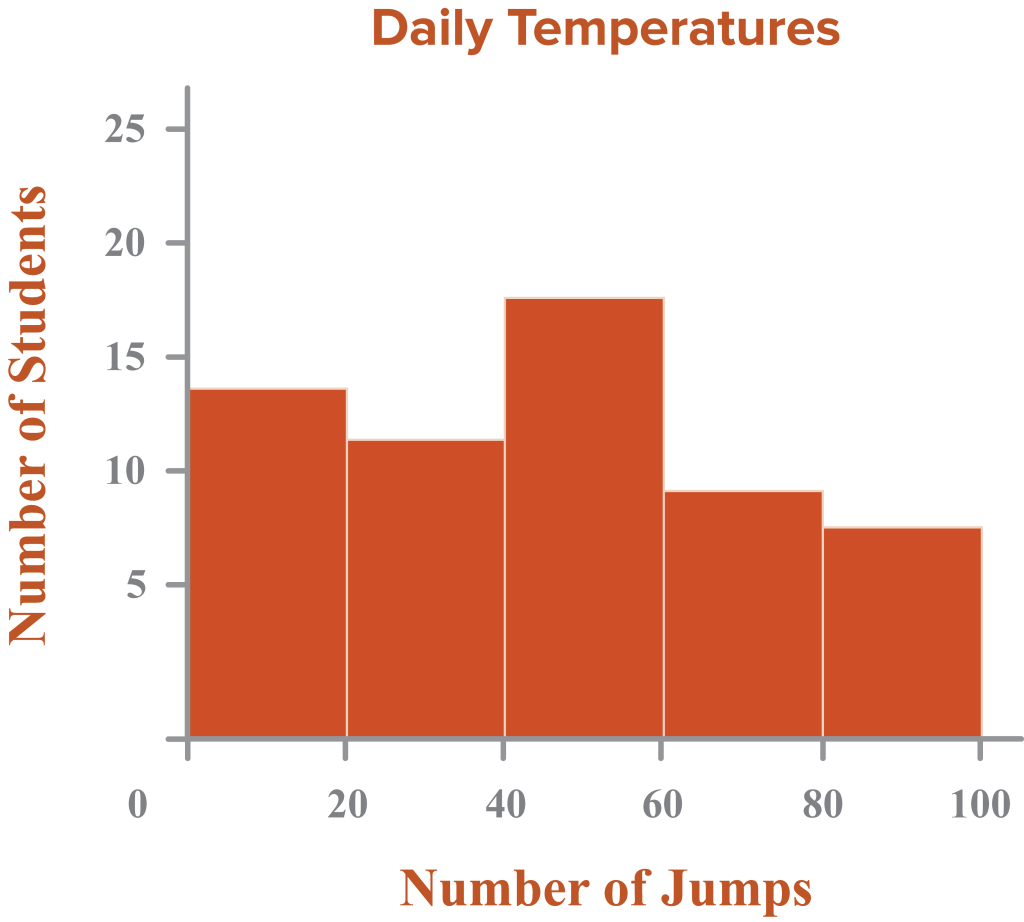
- Garfield Elementary had a jump rope contest. The school determined how many times the typical student could jump rope without missing. They collected the following data:
| Number of Jumps | Number of Students |
| 0–19 | 14 |
| 20–39 | 11 |
| 40–59 | 18 |
| 60–79 | 9 |
| 80–99 | 6 |
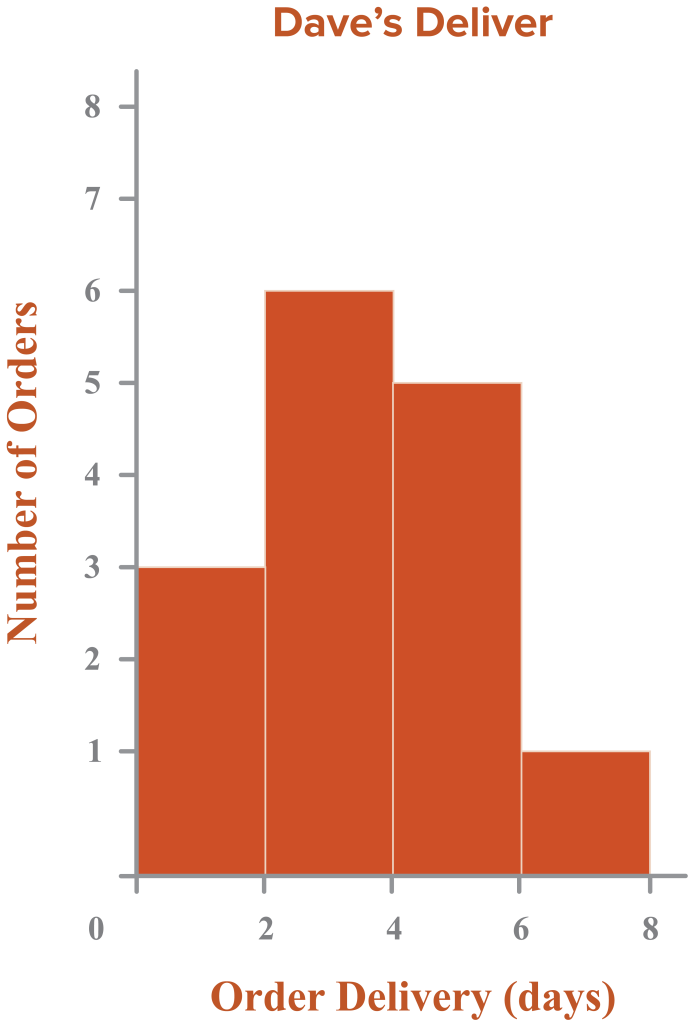
- Dave’s Delivery Service made 15 deliveries this month and recorded the number of days it took to deliver each order. Construct a histogram.
Construct a bar graph.
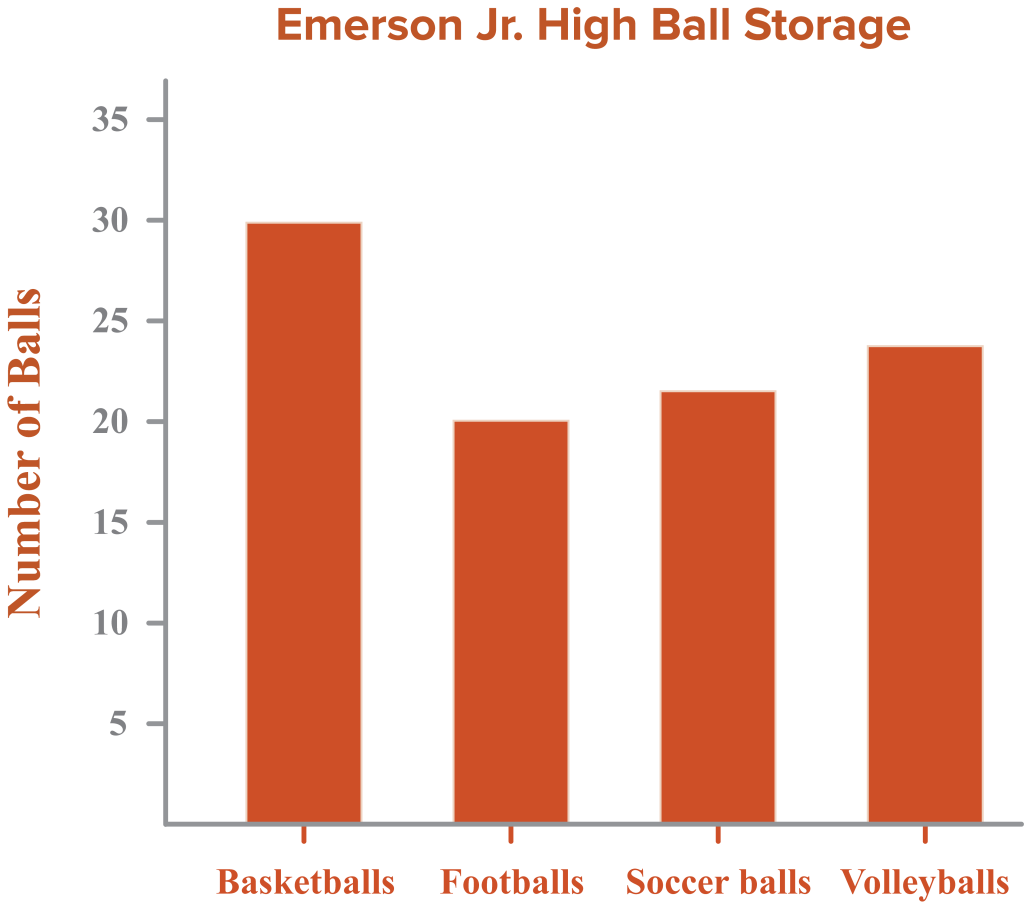
- Emerson Jr. High listed the number of balls a sport had in storage in the following table. Construct a bar graph.
| Type | Number of balls |
| Basketballs | 30 |
| Footballs | 20 |
| Soccer balls | 18 |
| Volleyballs | 24 |
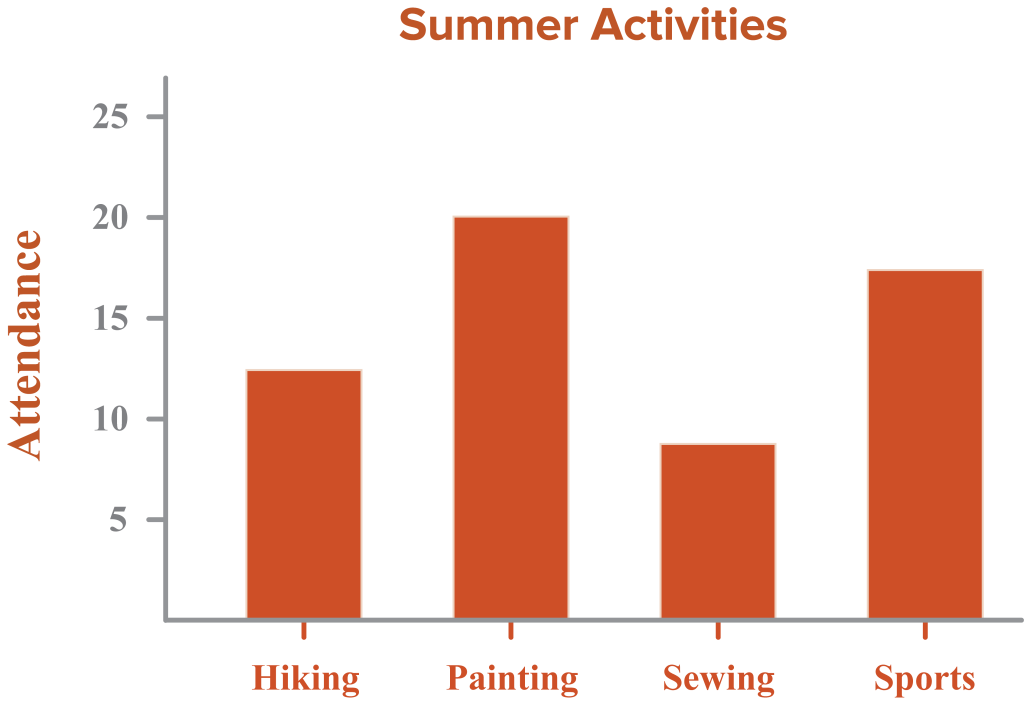
- A local community center listed the attendance for different summer activities. Construct a bar graph.
| Activity | Attendance |
| Hiking | 12 |
| Painting | 20 |
| Sewing | 9 |
| Sports | 16 |