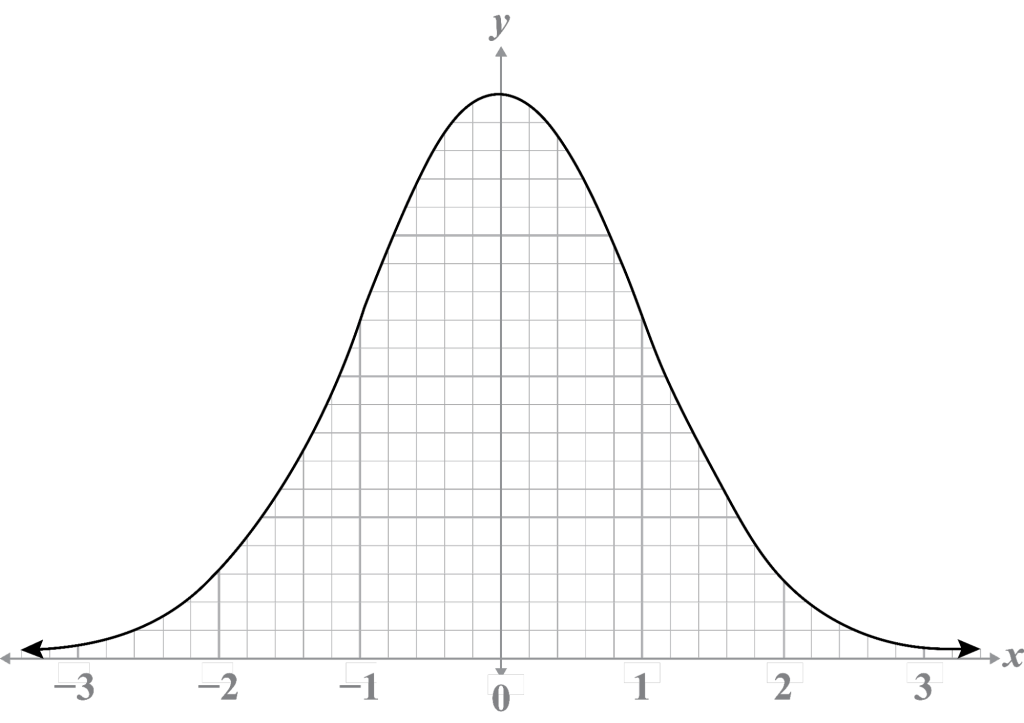
The standard normal distribution is always centered at zero on the x-axis with intervals that increase or decrease by one on each side of zero.
Therefore:
This type of distribution is a density curve with an area always equal to one square unit , or in terms of a proportion, 100%.
Because the mean is zero, 50% of the data is below the mean (and 50% is above the mean).
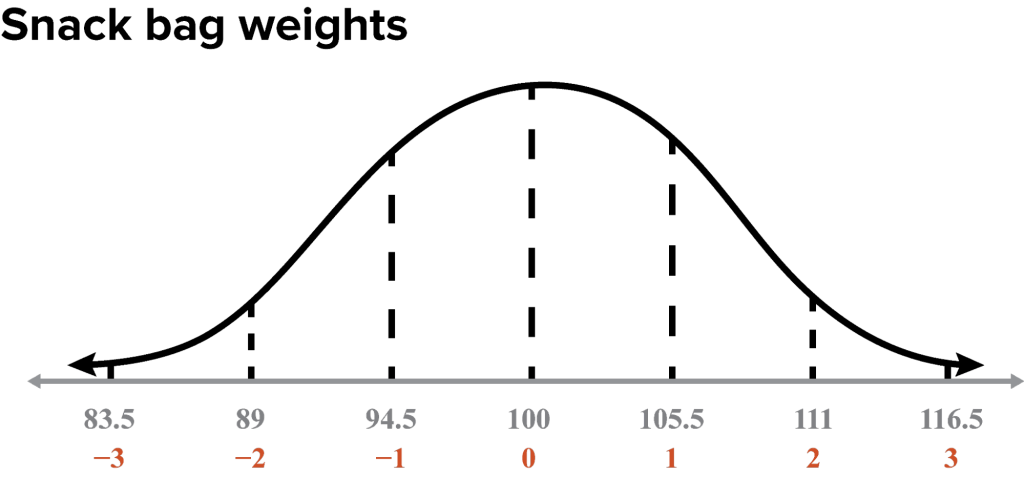
Any normally distributed data set can be standardized using the z-score formula :
A z-score is a measure of how many standard deviations, 𝜎, a data point is from the population mean , 𝜇.
When a data set is standardized, it can be compared with any other standardized data set using z-scores.
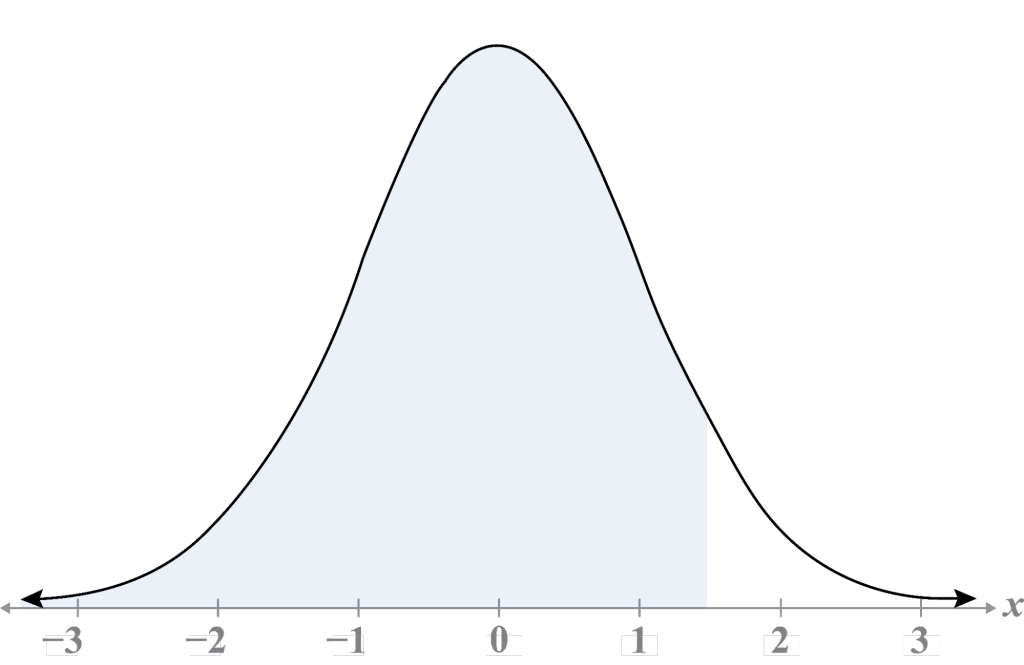
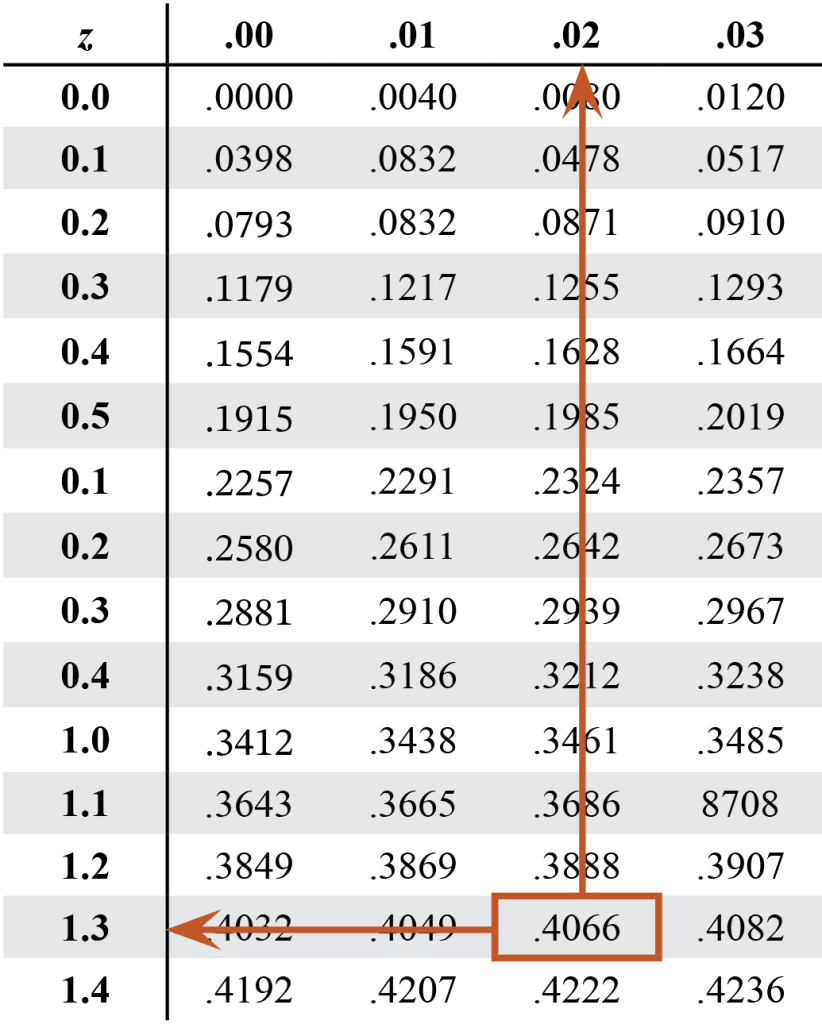
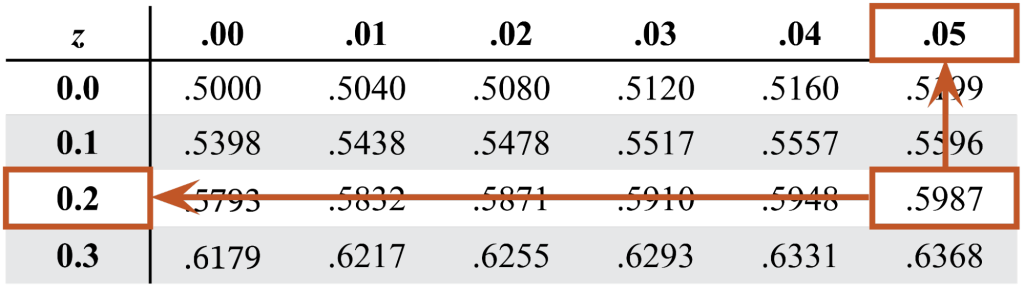
Once the z-score is calculated, a standard normal table, or z-table , is used as a reference to find where the value falls under the curve .
The z-table determines the exact area to the left of a specific z-score.
The area can be written as a proportion or percentage from the z-table.
The top row and left column correspond with the z-score.
When analyzing z-values using the z-table:
Ask yourself: What proportion of the data is less than X?
Write answers using the math shorthand: .
You will need the z-table for this lesson. The z-table is located in the Statistics and Probability Formula Sheet.
Example 1
Standardize the normal distribution.
Example 2
A high school track coach calculated the post-season mile times to be . What proportion of runners on the track team ran a mile in less than 6:30 minutes?
Example 3
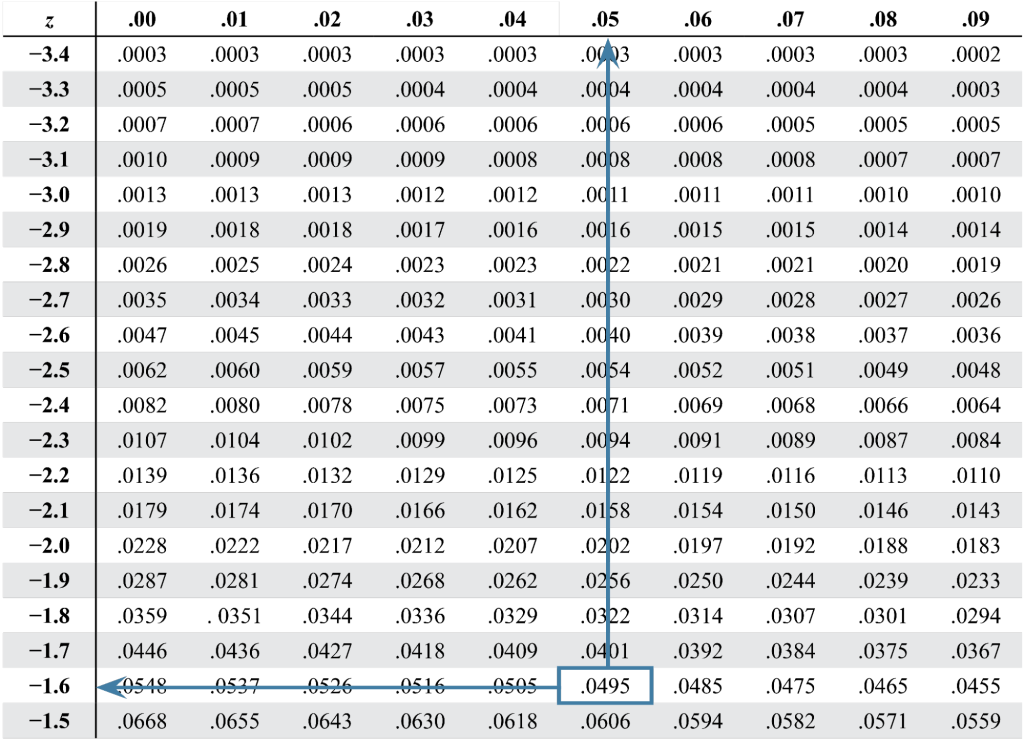
The area for a standard normal distribution is 0.0495 with a mean of 7.5 and a standard deviation of 1.5. Determine the raw data value. Explain.
Approximately 4.95% of the data will be below the value 5.025.