
Increasing and Decreasing Intervals with Technology Solutions
How to Describe Intervals Using Turning Points (and End Behaviors)
| Interval Description | x | y | Interval Notation |
| x- and y-values increase across the interval | ↑ | ↑ | increasing: |
| x-values increase and y-values decrease across the interval | ↑ | ↓ | decreasing: |
| x-values increase and y-values remain the same | ↑ | ↔ | constant: |
Note
These descriptions should sound familiar. In linear functions, they describe the rate of change (or slope) as well. While these graphs are not linear, they can be described generally as increasing, decreasing, or constant.
Depending on the problem, you may also be asked to identify other characteristics from the graph.
How to Express Interval Descriptions
Example 5
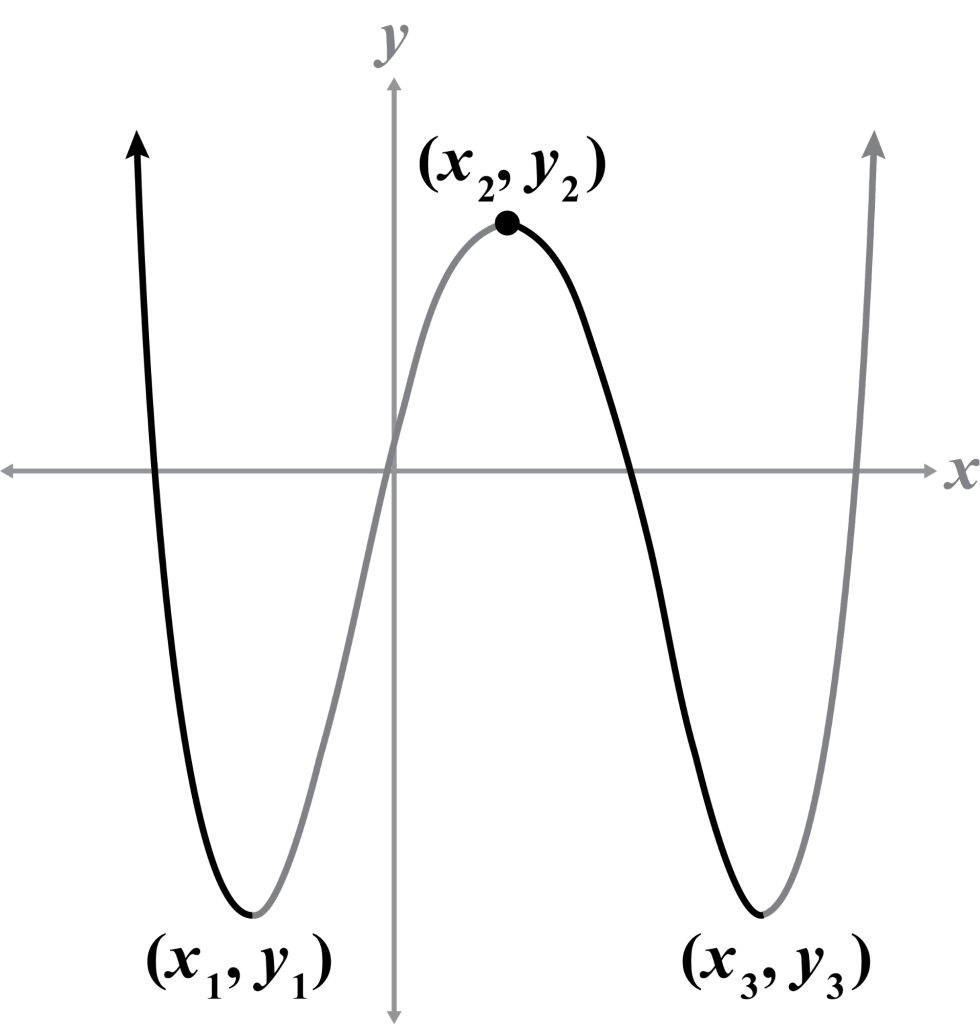
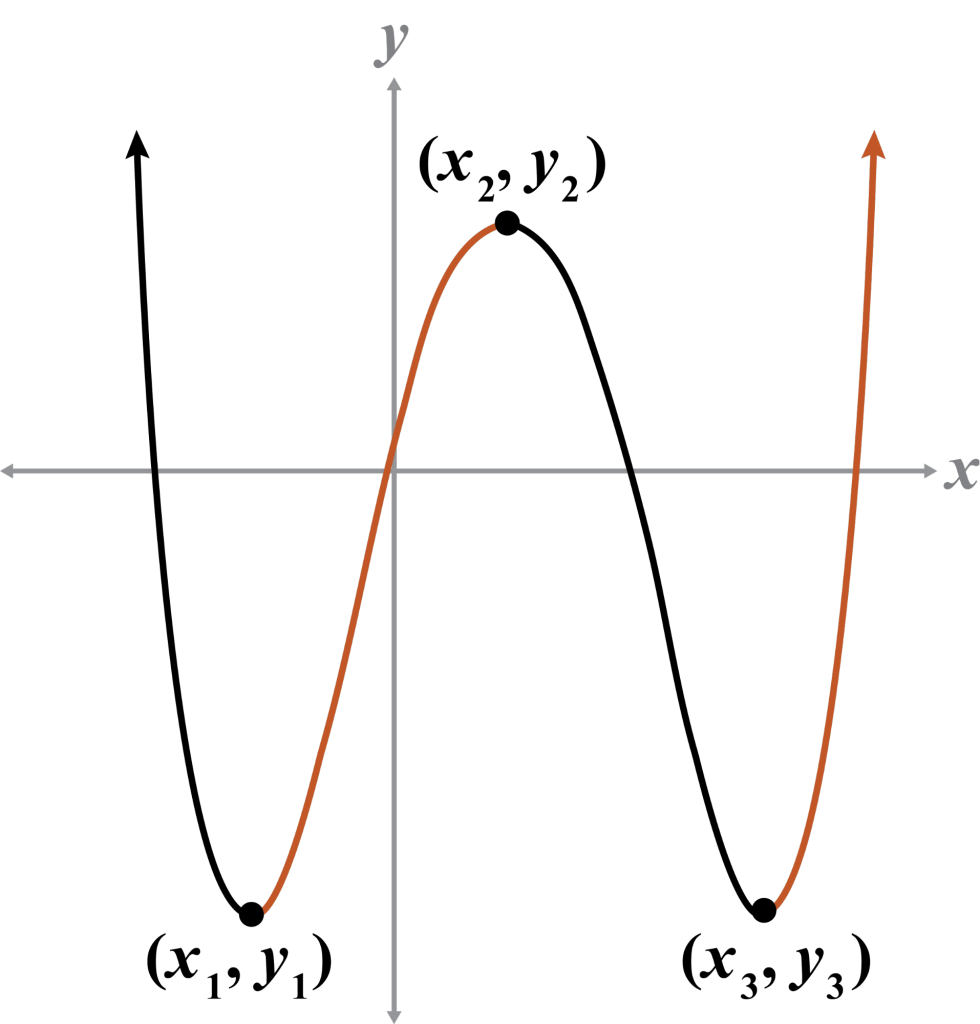
Name the interval(s) in which the function increases and decreases.
Note
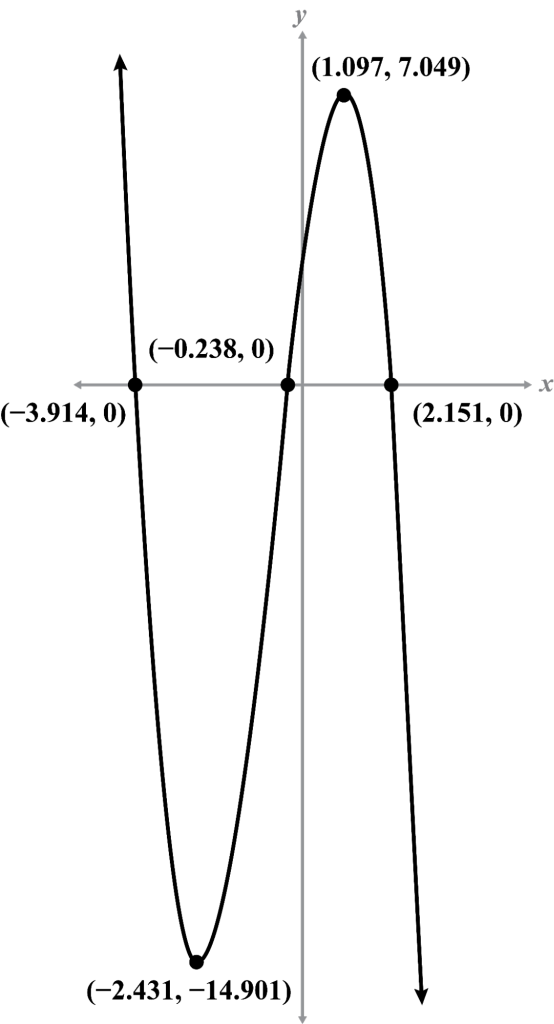
If you want to explore this function more on your own using technology, the equation for the graph is:
Example 6
- Name the interval(s) in which the function increases and decreases.
- Name the relative minimum and maximum over the interval .
| x | y | |
| –1.796 | 12.166 | ↑ |
| –0.509 | –4.158 | ↓ |
| 1.226 | 16.93 | ↑ |
| 2.678 | –6.888 | ↓ |
Note
Notice the relative minimum and maximum points are not the highest and lowest points on the graph, but they are the relative minimum and maximum for the given interval, .