Explore
Describing Data Distributions Solutions
- Measures of center help determine single values that can represent a data set or population .
- The measures of center are:
- Mean (μ): population average
- Median: middle number when the data set is in ascending order
- Mode: most frequently occurring number in a data set
- The closer the measures of center are to one another, the more symmetrically distributed they are, making the mean the representative measure of center.
- Technology should be used to calculate the mean, median, and mode of a data set, to allow for more time to analyze the data .
- In statistics, the mean (as well as the variance and standard deviation) is rounded to one decimal place further than the raw data.
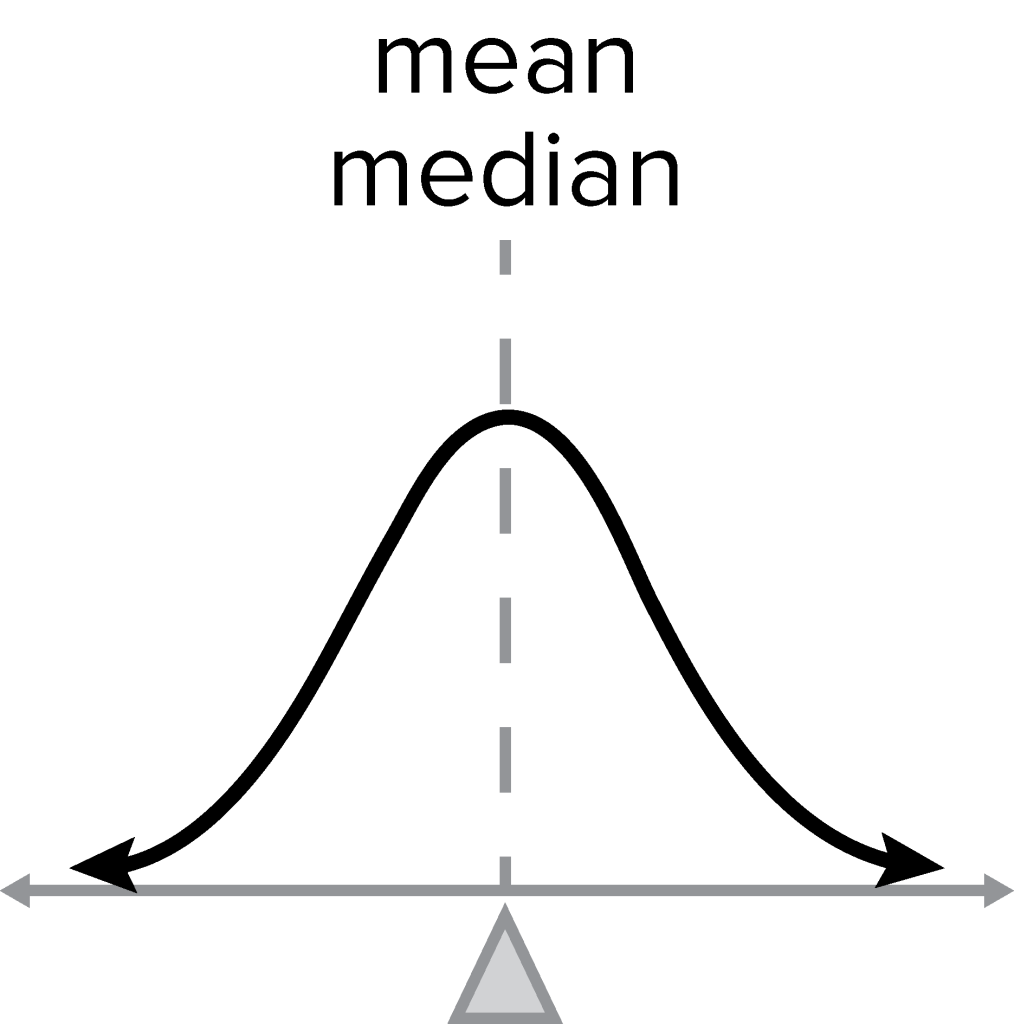
Symmetric Distribution
- The distribution is symmetric when .
- This is also called a normal distribution .
- Real-life data sets will only be approximately symmetric because no data set is perfectly normal.
Note
There are some instances where the mean and median are equal, but the data is still skewed because one or more values of the data set are outliers.
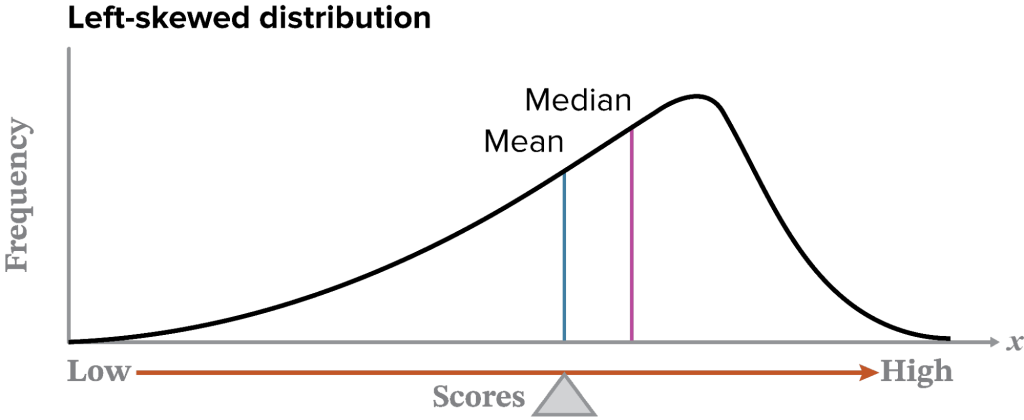
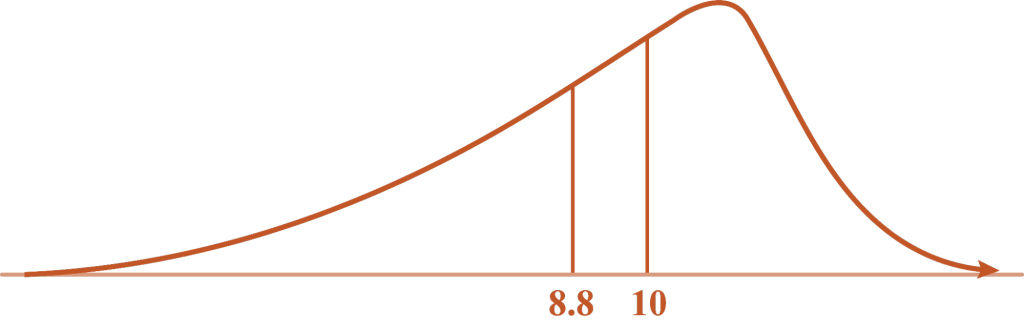
Left-Skewed Distribution
- Generally, the distribution is left-skewed when the
- This distribution is also referred to as negatively skewed.
- The numbers in the data set are pulling the mean to the left , toward negative values.
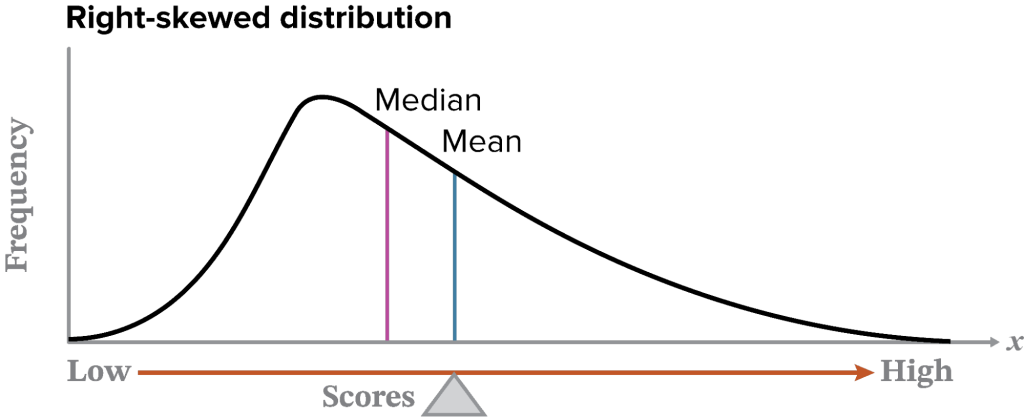
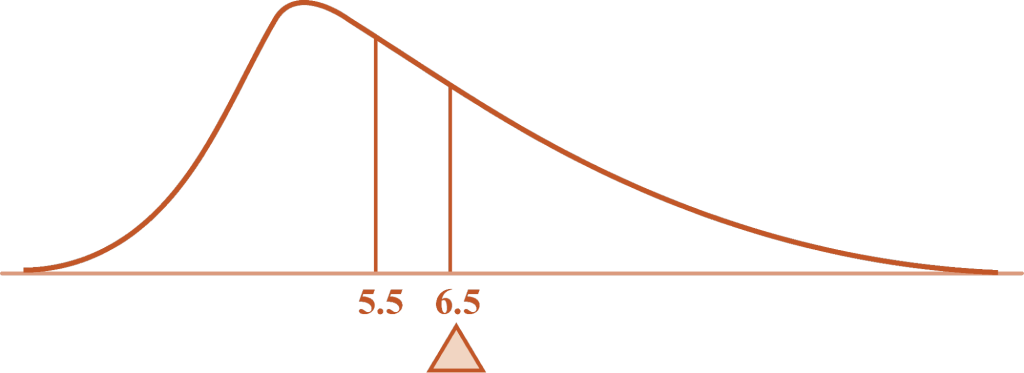
Right-Skewed Distribution
- Generally, the distribution is right-skewed when the .
- This distribution is also referred to as positively skewed.
- The numbers in the data set are pulling the mean to the right , toward positive values.
- There are some instances where the mean and median are equal, but the data is still skewed because one or more values of the data set are outliers .
- No matter the distribution, it is important to look carefully at both:
- the measures of center
- the data set as a whole
- When distribution is skewed, the median is a better representation of center than the mean because it is not affected by outliers .
Note
Outliers are not the focus of this lesson. See Algebra 1: Principles of Secondary Mathematics for more.
Example 1
Name and sketch the distribution.
Use technology to calculate mean and standard deviation of population. For more information on how to enter data into a scientific calculator, see the More to Explore.
Example 2
Calculate the measures of center. Then name the distribution.