
Try It Out!: Part 7 Solutions
Construct a number line and plot the decimals below.
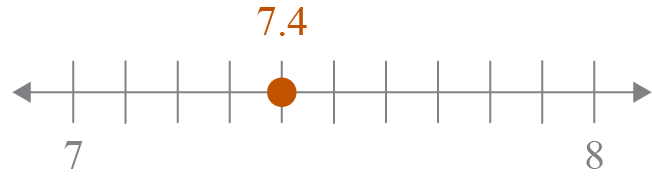
- Plot 7.4 on a number line.
Step 1:
Identify the integers this value is between.
7.4 is between 7 and 8.
Step 2:
Draw a number line that extends from one integer to the other.
Step 3:
Divide the number line into the necessary number of sections in order to plot this value.
The decimal of 0.4 is in the tenths place so divide the space between 7 and 8 into 10 equal sections.
Step 4:
Plot the value.
0.4 has a value of 4 tenths, which means it needs to be plotted on the 4th point between 7 and 8.
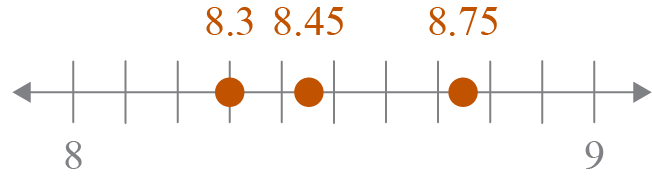
- Plot 8.75, 8.3, and 8.45 on a number line.
Step 1:
Identify the integers the values are between.
8.75, 8.3 and 8.45 are all between 8 and 9.
Step 2:
Draw a number line that extends from one integer to the other.
Step 3:
Divide the number line into the necessary number of sections in order to plot the values.
The best way to plot all 3 values would be to divide the number line into 10 equal sections.
Step 4:
Plot the values.
- 8.3 can be plotted on the third point to the right of 8.
- 8.45 falls between 8.4 and 8.5, so it will not be plotted exactly on a point.
- 8.75 falls between 8.7 and 8.8, so it will not be plotted exactly on a point.
Explain: Part 7 Solutions
- In your own words, explain how to plot rational decimals on a number line.
Note
Answers may vary, but should include the content below.
- Discuss the importance of setting a range that includes all of the data points.
- Discuss the importance of dividing the number line intervals to match the decimal you are working with. For example, for decimals in the tenths, the number line should be divided into tenths.
- Discuss locating the correct positions on the number line for each decimal.