Part 7: Plotting Rational Decimals on a Number Line Solutions
Use the steps outlined in your Online Lesson to complete the example below.
Example 1
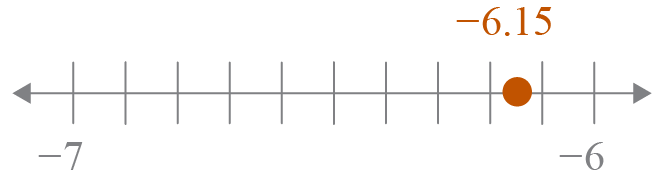
Plot − 6.15 on a number line.
Step 1:
Identify the integers this value is between.
− 6.15 is between − 7 and − 6.
Step 2:
Draw a number line that extends from one integer to the other.
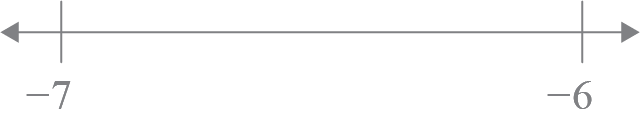
Step 3:
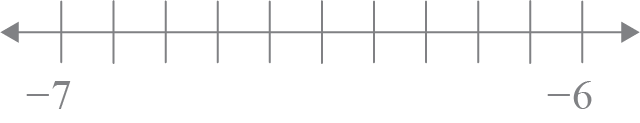
Divide the number line into the necessary number of sections in order to plot this value.
The decimal of − 6.15 is halfway between − 6.20 and − 6.10. Divide the space between − 7 and − 6 into 10 equal sections.
Note
Although the decimal value ends in the hundredths place, it would be impractical and unnecessary to divide the number line into 100 sections. So, we divide into tenths and approximate the placement.
Step 4:
Plot the value.
− 6.15 is plotted halfway through the second section towards the left from − 6, which is between − 6.20 and − 6.10. It will not be plotted exactly on a point.