
Test 27 (Lessons 53–54): Introduction to Probability Solutions
For problems 1–6, determine the probabilities using the fair spinner. Write answers in simplified form.
Note
{A, E}

Note
{2, 4, 6}
Note
- Explain which event (problems 1–5) is the most likely to occur.
Problem 5 is most likely to occur because the answer is one.
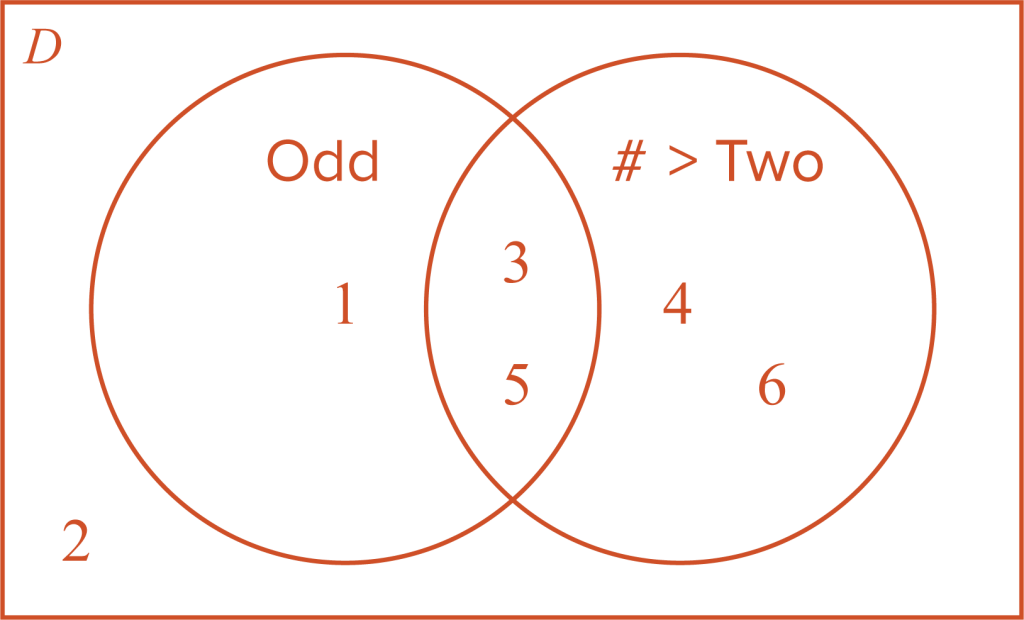
- Construct a Venn diagram D to represent possible rolls of a single die containing the subsets: odd rolls and rolls greater than two.
For problems 8–10, use the two-way table.
A small survey was conducted at a college to determine where students and professors lived.
- A student living off campus
| On Campus | Off Campus | |
| Student | 360 | 75 |
| Professor | 6 | 84 |
- A professor or student living on campus
- A professor living on campus
For problems 11–15, use the following scenario.
Ms. Liu’s class conducted an experiment by placing 20 cards in a bag. Each time a card was drawn, it was replaced before drawing another.
11–13) Find the probability of each card color to the nearest whole percent.
Experiment Results
| Card | Tally |
| red | 74 |
| blue | 88 |
| yellow | 82 |
- Ms. Liu says there are approximately the same number of each color card in the bag. Explain if the experiment was conducted fairly.
Sample: This is a fair experiment because the percentages are approximately the same for each color, and the tallies are very close together.
- Estimate how many cards of each color were in the bag using the experiment.
There are 6 red, 7 blue, and 7 yellow cards in the bag.