
Test 23 (Lessons 45-46): The Normal Curve Solutions
This test requires your student to use the z-table found in the Statistics and Probability Formula Sheet.
- In an environmental science class, Anabeth recorded the height in millimeters of six plants before they were about to flower. After measuring, she wanted to know the average height as well as how much the plant heights varied. Calculate the mean and standard deviation. Show your work.
Name the type of data distribution.
For problems 4–5, the mean is 16.5, and the standard deviation is 2.3.
- Find the area of the shaded region.
- Find X when .

For problems 6–10, use the normal distribution.
- How likely is it that a woman has a shoe size between 38.1 and 40.9? Explain.
68% because is one standard deviation on either side of the mean.
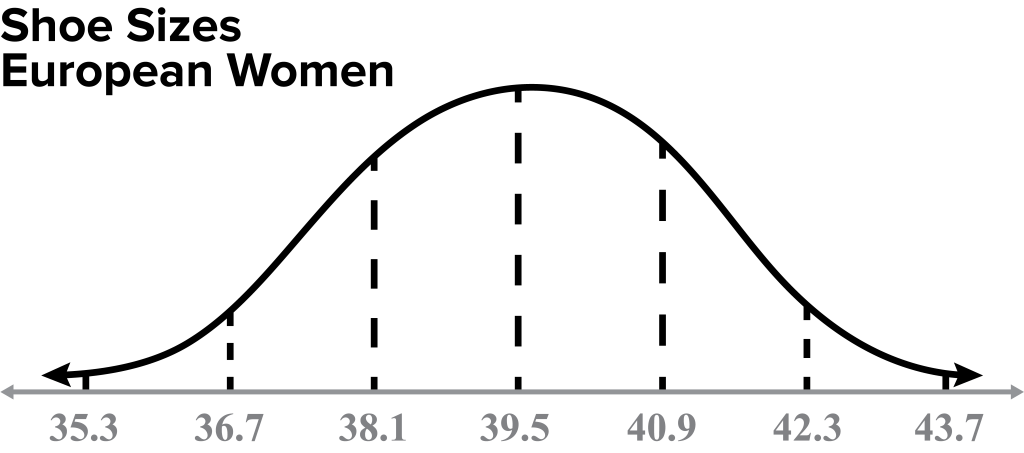
- If 300 women were randomly selected, how many are expected to have a shoe size greater than 38.1?
There will be 252 women with a shoe size greater than 38.1.
- Determine the likelihood that a randomly selected woman wears a size 38.5 or smaller to the nearest whole percent.
The likelihood of a randomly selected woman wearing a size 38.5 or smaller is 24%.
- Determine the likelihood that a woman wears between a 38.5 and 40.5 shoe size depending on the style.
The likelihood that a woman wears between a 38.5 and 40.5 shoe size is 57%.
- A shoe manufacturer wants to produce a shoe that accommodates the majority of women purchasing shoes. What shoe size (whole or half) represents the 88th percentile of women’s shoes?
A size 41 shoe represents about 88% or less of women.