
Practice 2 Solutions
Describe the Venn diagram in symbols.
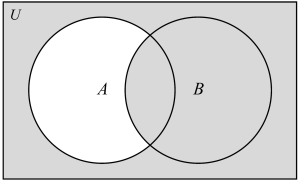
A’ ⋃ B
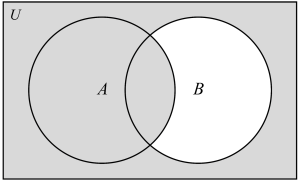
A ⋃ B’
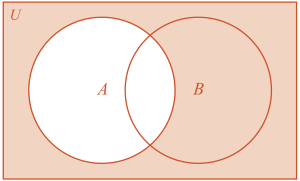
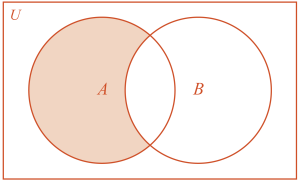
Sketch and shade the Venn diagram to represent the notation.
- A’
- A ∩ B’
For problems 5–8, a job application survey was completed by 150 randomly selected people.
Job Applicant Survey
| College Diploma | |||
| Yes | No | ||
| Work Experience | Yes | 41% | 23% |
| No | 18% | 18% | |
Note
| College Diploma | ||||
| Yes | No | |||
| Work Experience | Yes | 41% | 23% | 64% |
| No | 18% | 18% | 36% | |
| 59% | 41% | 100% | ||
59%
- The number of people who have a diploma and no experience
There are 27 people with a diploma and no work experience.
- The number of people who have a diploma or experience
There are 123 people who have a diploma or work experience.
Note
This problem can also be solved by using the complement, no diploma and no work experience.
18%
For problems 9–14, use the set of numbers.
- Create a two-way table for rational, ℚ, and irrational, 𝕀, numbers.
Rational, ℚ:
Irrational, 𝕀:
Not rational or irrational:
Rational and irrational: none
| 𝕀 | 𝕀’ | |
| ℚ | 0 | 5 |
| ℚ’ | 3 | 3 |
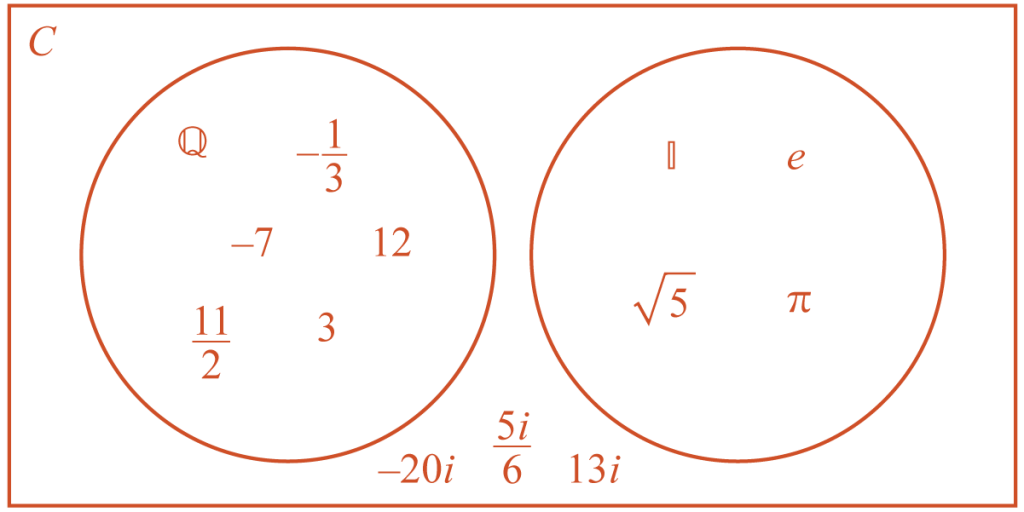
- Create a Venn diagram for rational, ℚ, and irrational, 𝕀, numbers.
Rational, ℚ:
Irrational, 𝕀:
Not rational or irrational:
Rational and irrational: none
- A rational number
- A rational and irrational number
0
For problems 15–20, all possible sums for two dice are recorded in the table.
| 1 | 2 | 3 | 4 | 5 | 6 | |
| 1 | 2 | 3 | 4 | 5 | 6 | 7 |
| 2 | 3 | 4 | 5 | 6 | 7 | 8 |
| 3 | 4 | 5 | 6 | 7 | 8 | 9 |
| 4 | 5 | 6 | 7 | 8 | 9 | 10 |
| 5 | 6 | 7 | 8 | 9 | 10 | 11 |
| 6 | 7 | 8 | 9 | 10 | 11 | 12 |
- A sum of 5
- A sum of 3 or 11
- Not the sum of either 12 or 3
- What sum is most likely to be rolled? Explain.
A sum of 7 occurs the most times, which means it has the greatest likelihood of being rolled.