
Practice 1 Solutions
Describe the Venn diagram in symbols.
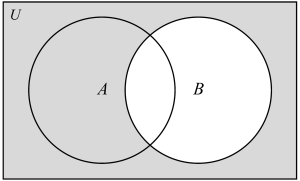
B’
Sketch and shade the Venn diagram to represent the notation.
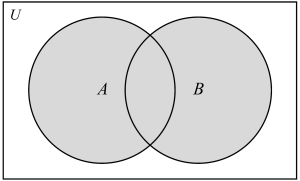
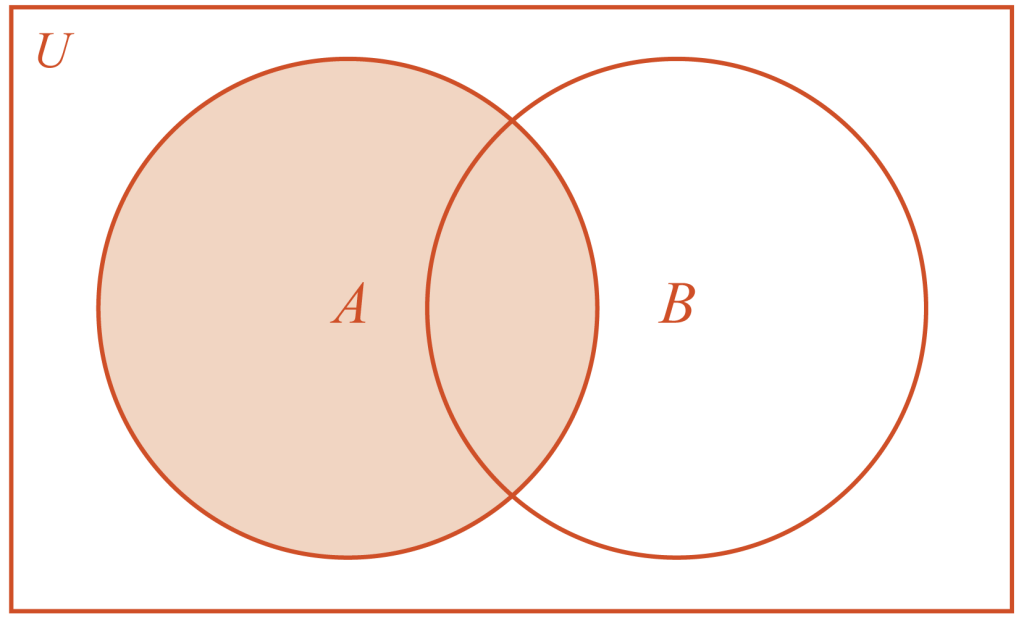
- A
- What is the difference between mutually exclusive and inclusive?
Sample: Mutually exclusive events do not have any overlapping events (intersecting events). Inclusive events have at least one event that is in the intersection of the sets.
- What is a compound event in probability?
A compound event in probability is made up of two or more simple events.
For problems 7–12, determine probabilities of a standard card deck.
- Probability of a red two
0
- Which problems are mutually exclusive? Explain.
Sample: Problems 7 and 11 are mutually exclusive because the events in these sets do not intersect.
For problems 13–18, the set of numbers, , contains the subsets for prime numbers and even numbers.
- Create a two-way table.
Prime, P: {5, 7, 11, 13}
Even, E: {4, 6, 8, 10, 12, 14}
Not even and not prime: {9, 15}
Prime and even: none
| P | P’ | |
| E | 0 | 6 |
| E’ | 4 | 2 |
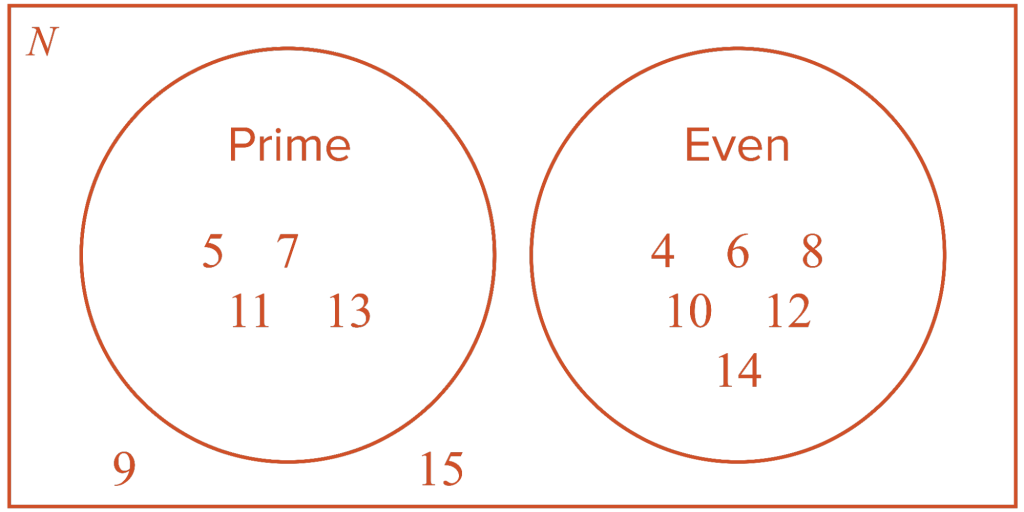
- Create a Venn diagram.
Prime, P: {5, 7, 11, 13}
Even, E: {4, 6, 8, 10, 12, 14}
Not even and not prime: {9, 15}
Prime and even: none
Multiple of 3: {6, 9, 12, 15}
Factors of 15: {5, 15}
- Determine the probability of choosing an even number that is not prime.
- Determine the probability of choosing a number that is not even and not prime.
For problems 19–24, use the two-way table and write answers as a percentage, rounded to the nearest tenth.
The table compares the types of colleges and the degrees offered by 30 colleges in the state of Maine.
| Private | Public (Not Private) | |
| Associate College | 3.33% | 23.33% |
| Other | 50% | 23.33% |
Note
You can find the individual values for each cell if you choose.
| Private | Public (Not Private) | Total | |
| Associate College | 3.33% (1) | 23.33% (7) | 8 (26.66%) |
| Other | 50% (15) | 23.33% (7) | 22 (73.33%) |
| Total | 16 (53.33%) | 14 (46.66%) | 100% |
- Determine the percentage of associate degree colleges in Maine.
Associate college row:
26.66%
- Determine the number of public associate degree colleges.
7 public associate degree colleges
- Determine the percentage of colleges that are non-associate degree colleges.
73.33%
- Determine the number of private, non-associate colleges.
15 colleges are private, non-associate degree colleges.
- Explain if this data represents mutually exclusive or inclusive events.
This represents inclusive events because there is an intersection between any two subsets.
- If one college were randomly selected, which one is the least likely to be selected? Explain.
The least likely to be selected is the private associate college because only 3.33% of colleges have this degree program.