
Mastery Check Solutions
Show What You Know
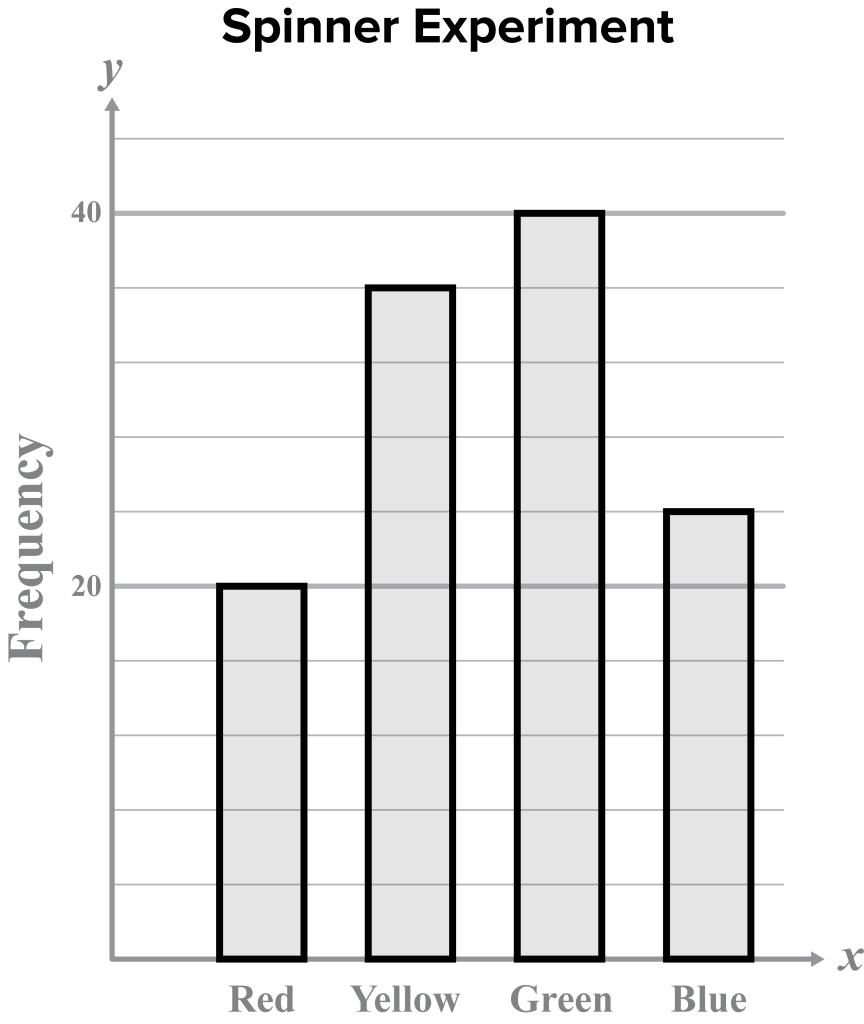
A bar graph was created to track the number of spins for an experiment.
- Determine the probability as a percent for each color on a spinner using the bar graph.
Note
Q: Is the probability theoretical or experimental? Explain.
A: This is experimental because you are using the information from the experiment.
- Looking at the outcomes from the experiment, what color(s) do you expect to occur? Explain.
Sample: The arrow stopped most often on yellow (30%) and green (33%), and they have an almost equal percentage of occurring. This means together (63%) they are more likely to occur than the other colors.
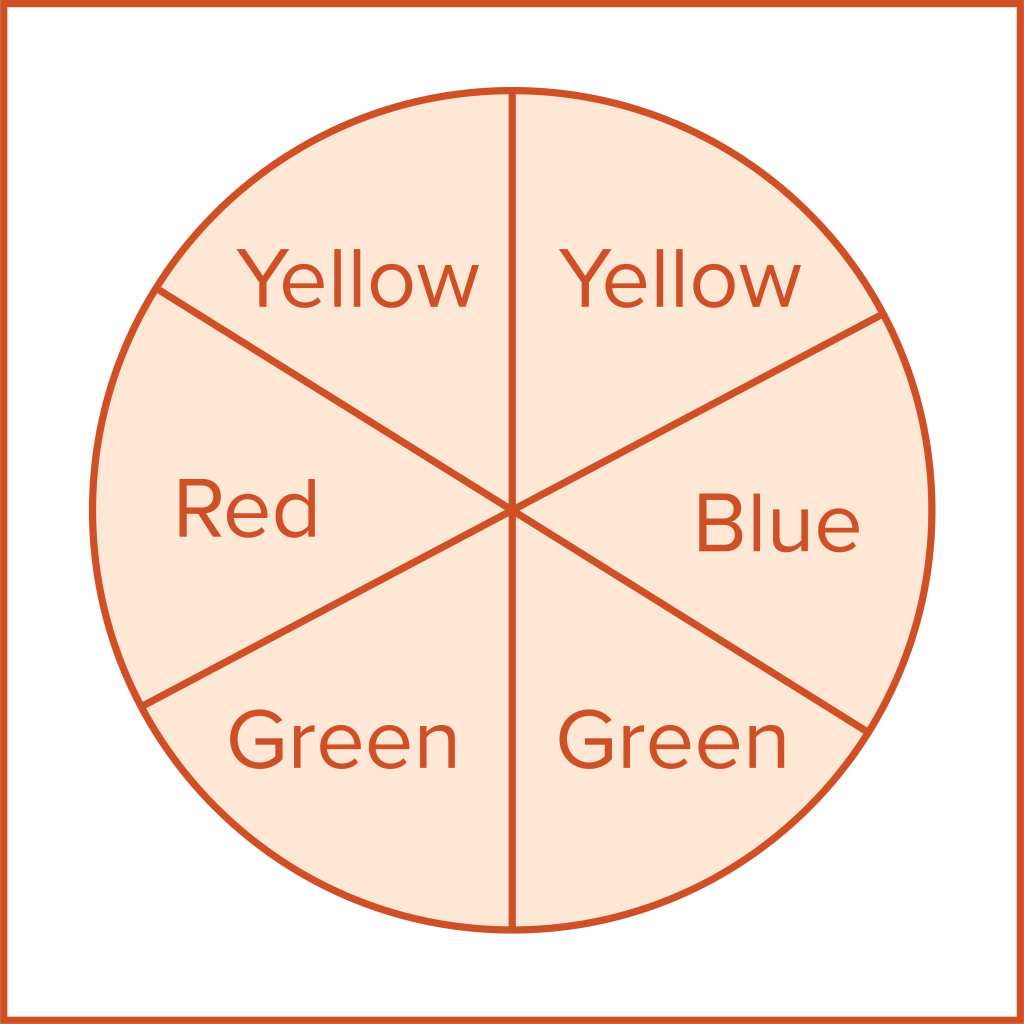
- Draw and label a spinner with six wedges that represent the experiment.
Note
Q: From the experiment, what colors would you expect to repeat on the spinner? Explain.
A: yellow and green
To answer part C with the given answers, it is critical that the spinner has six sections. The sections can be labeled in a different order, but should have the same number of pieces.
- Estimate the probability as a percentage for each color of the spinner you drew in part C.
Say What You Know
In your own words, talk about what you have learned using the objectives for this lesson and your work on this page.
Note
Restate the objectives of the lesson in your own words. If you are unable to restate the lesson objectives, go back and reread the objectives and then explain them.
- Calculate theoretical probability.
- Calculate experimental probability.
- Analyze probabilities to make fair decisions.