
Explore
Error and Confidence Solutions
Note
Inferential statistics generalize, or infer, from a sample what is likely to happen in the population. See Lesson 47 to review.
Maximum Error of the Estimate (Margin of Error)
Note
In this lesson, the focus is the confidence in estimating the population mean, μ.
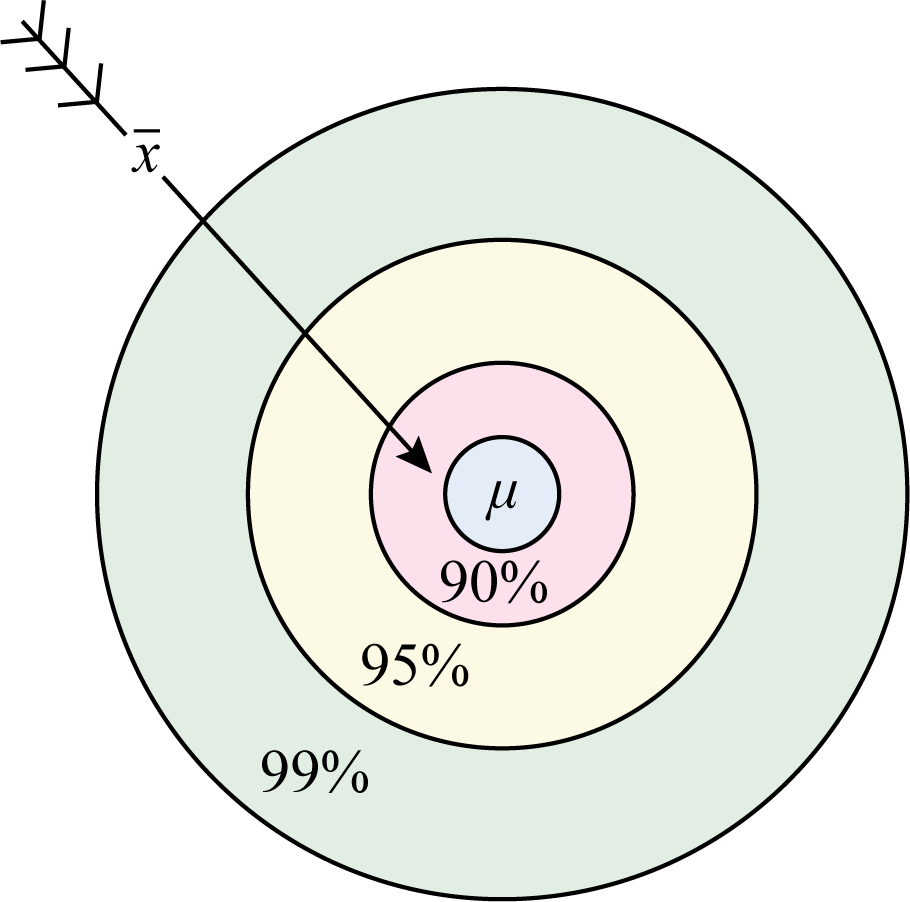
Confidence Level
| Confidence Level | z-score |
| 90% | 1.645 |
| 95% | 1.960 |
| 99% | 2.576 |
Confidence Interval
Example 1
In 2023, a random sample of 60 retail employees in a large city found the sample mean wage was $17.25 per hour with a standard deviation of $3.50 per hour. Calculate the confidence intervals (CI) with 90% and 99% certainty for the population mean. Explain.
You can be 90% certain that the hourly wage of retail employees in the city will be between $16.50 and $18.00 .
You can be 99% certain that the hourly wage of retail employees in the city will be between $16.09 and $18.41 .
Note
The CI at 90% is more precise, and the CI at 99% is more inclusive.
Rounding to an additional decimal place does not make sense for this problem because it pertains to money.
Example 2
At the Zander Zoo, a random survey of 350 visitors found that 83.7% are satisfied with the maps for navigating the zoo. Find the interval that most likely contains the population parameter for visitors dissatisfied with the zoo’s maps for a margin of error of .
It is likely that between 10.96% and 21.64% of the zoo’s visitors are dissatisfied with the maps.
Example 3
A national movie theater chain wants to estimate the average number of ounces of popcorn purchased per movie ticket sale. From years of data, they know the population standard deviation for popcorn purchases per ticket sale is 4.5 ounces. The chain wants to be 95% confident in their estimate and decides to take a random sample of 100 movie ticket sales.
The theater chain can be 95% confident that their estimate will be no more than 0.88 oz away from the population mean.
Note
Remember that statistics round to one place value more than the given information.
Example 4
A Bright Idea manufactures light bulbs and needs to estimate the average lifespan of a new type of bulb. They know from pilot studies that the standard deviation (s) of a light bulb’s lifespan is 120 hours. They want to be 99% confident that their estimate is within 25 hours of the true average lifespan. What is the minimum sample size that can be tested to reach a 99% confidence level for A Bright Idea?
A Bright Idea needs to test a minimum of 153 light bulbs to be 99% confident about the lifespan of their light bulbs.
When looking for the minimum sample, round up to the nearest whole number.