
Practice 2 Solutions
Name the area for the standard normal curve as a proportion and a percent.
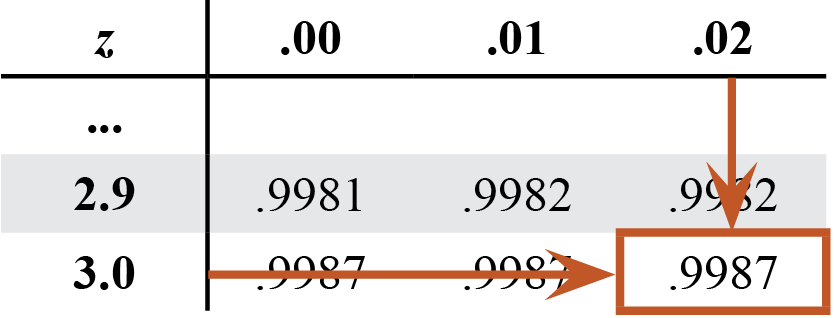
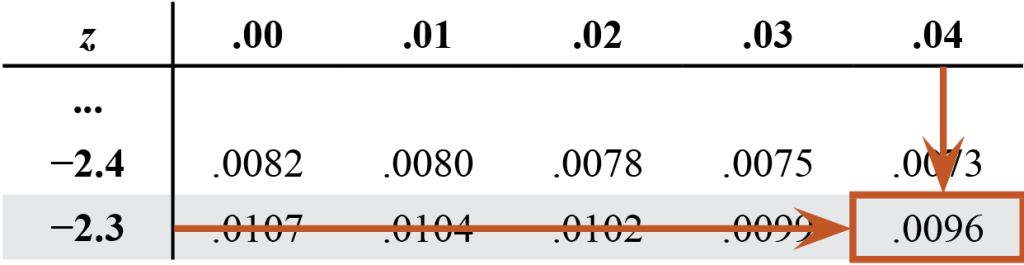
Determine the z-score given the proportion.
- 0.3970

- 0.3781
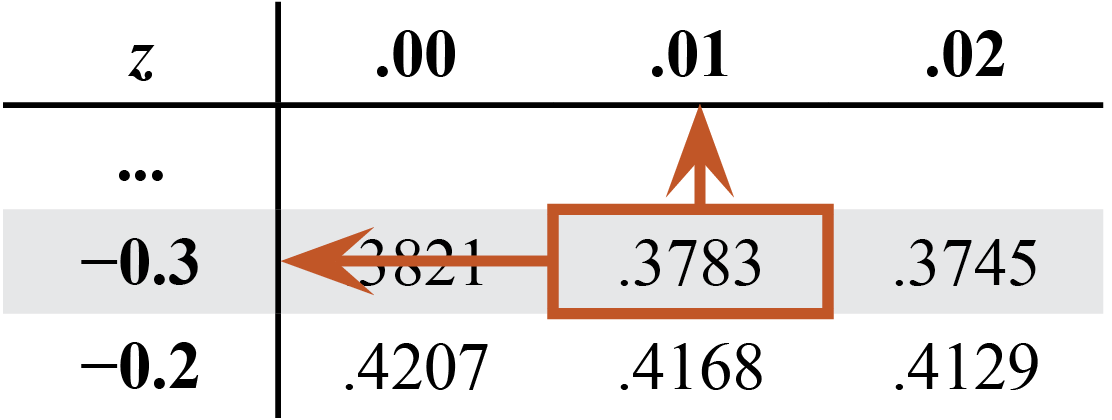
For problems 5–8, calculate the z-score. Then determine the percentage or raw data score.
Mr. Bartz’s class recorded their nightly reading times in minutes over a two-week period. He calculated the class average to be 22 minutes with a standard deviation of 3 minutes.
- What percentage of the class read less than 15 minutes per night?
In Mr. Bartz’s class, 0.99% of students read less than 15 minutes per night.
- What percentage of Mr. Bartz’s students read more than 25 minutes per night?
About 16% of students read more than 25 minutes per night.
Note
Q: If the z-table represents the area below the z-score, how do you find data above the z-score?
A: Subtract the area from one
Q: From the Empirical rule, what is the percentage of data greater than one standard deviation above the mean?
A:
Reference the image in the notes if needed.
- What percentage of students read between 17 and 20 minutes per night?
About 20% of students read between 17 and 20 minutes per night.
- How long, to the nearest minute, did 66% of Mr. Bartz’s class read?
About 66% of the class read for 23 minutes or less.
For problems 9–12, use the scenario.
Ms. Troglin’s botany class studied the growth of Flower B plants in centimeters (cm) over thirty days. On day zero, students planted seeds. Then on day thirty, students measured the height of each Flower B plant. Using their measurements, Ms. Troglin’s class calculated that the average height of the plants was 26.4 cm with a 1.2 cm standard deviation.
- What height does Ms. Troglin’s class expect 40% of all Flower B plants to be?
The class predicts that 40% of the plants are 26.1 cm or less in height.
- Determine the height of the top 5.05% of the plants.
The top 5.05% of plant heights were 28.37 cm or more.
- What percentage of plants were less than 23 centimeters?
- What percentage of plants were between 25 and 27 centimeters?
57.05% of plants were between 25 cm and 27 cm in height.
For problems 13–14, determine the missing value in the formula
For problems 15–16, use the scenario.
A fisheries biologist calculated the average length of a lake fish population to be 10.12 centimeters and the standard deviation to be 1.57 centimeters. Then, one year later, a sample of the population was measured.
|
Fish Length (cm)
|
||
|
8.0
|
8.4
|
9.5
|
|
9.4
|
7.3
|
7.4
|
|
6.2
|
8.5
|
|
|
10.1
|
10.0
|
|
- Complete the table to determine if the sample group of fish represents a normal data set.
|
z
|
–2
|
–1
|
0
|
1
|
2
|
|
Area < z
|
0.02
|
0.16
|
0.5
|
0.84
|
0.98
|
|
Predicted: 10z
|
6
|
||||
|
Actual Count
|
1
|
6
|
all
|
all
|
all
|
- Is the sample normally distributed? Explain.
Sample: The sample is not normally distributed because all of the values are below the mean.
Note
The population mean is not representative of the sample.