
Practice 2 Solutions
For problems 1–2, calculate the measures of center. Then sketch the distribution.
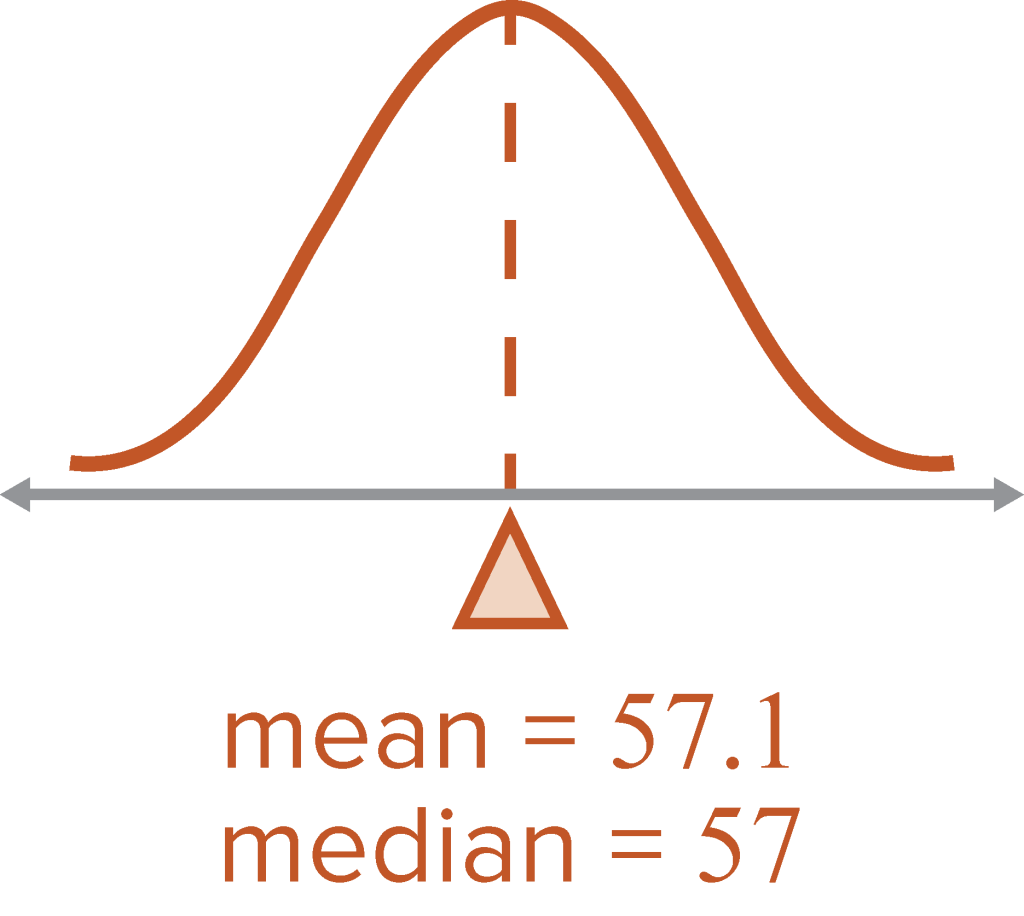
Median and mean are approximately equal. No skew. Normal distribution.
- Calculate the standard deviation.
For problems 4–11, use the given normal distribution.
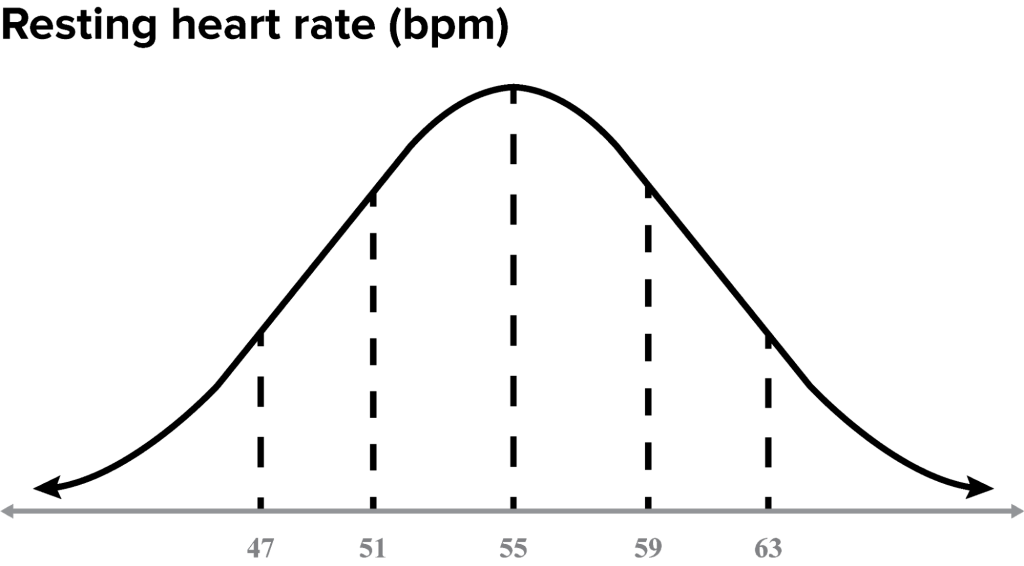
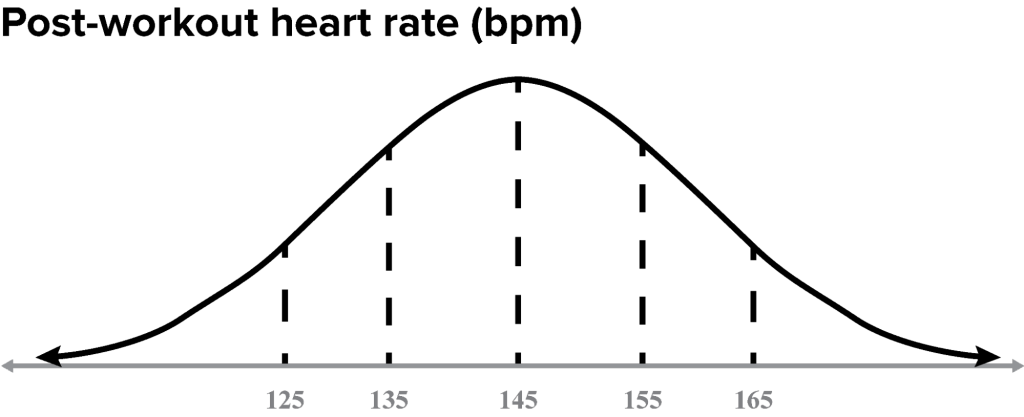
An athletic trainer measures athletes’ heart rates at rest and immediately after a workout. Measurements are in beats per minute (bpm).
- Name the mean and standard deviation.
- What percentage of athletes’ heart rates were higher than the mean?
50% of the data is always greater than the mean.
In both resting and post-workout, 50% of athletes’ heart rates are greater than the mean.
- If 125 athletes were monitored, approximately how many had a post-workout heart rate between 155 and 165 bpm?
A total of 17 athletes have a post-workout heart rate between 155 and 165 bpm.
- If 125 athletes were monitored, how many have a resting heart rate less than 51 bpm?
20 athletes have a resting heart rate less than 51 bpm.
- If 150 athletes were monitored, how many fell between one standard deviation from the mean?
102 athletes
- Write an inequality that represents 34% of the post-workout data above the mean (i.e., ).
See the Post-Workout graph.
Note
This is one standard deviation above the mean.
- The coach created a new workout for the athletes. It increased their average heart rate by 5 bpm, but decreased the variance by 3 bpm. Sketch a graph for the new workout (Workout 2).
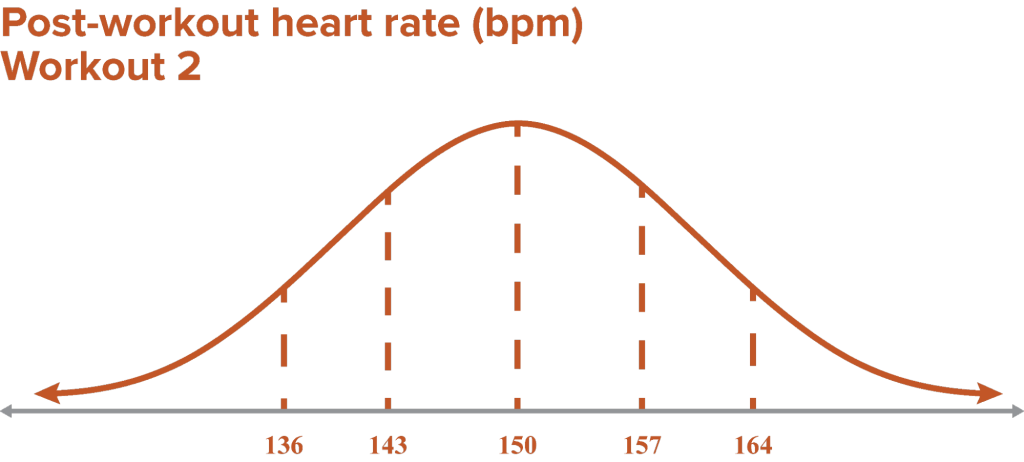
- The team coach tells the athletic trainer that during a game, the heart rates of the athletes vary greatly. Which workout should the trainer recommend to the coach?
The trainer should recommend the first workout because the athletes had a greater variability of heart rates.
- Calculate the standard deviation.