
Practice 1 Solutions
For problems 1–3, calculate the measures of center. Then sketch the distribution.
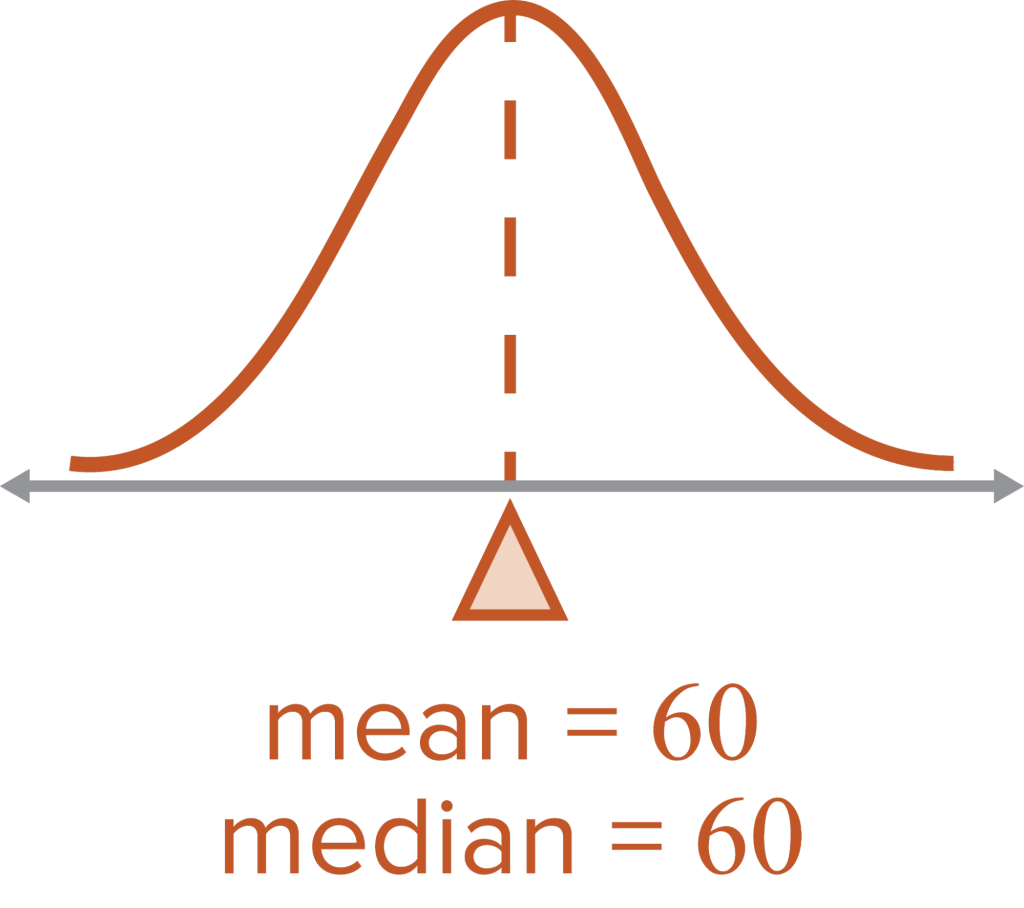
Median and Mean are equal. No skew. Normal distribution.
For problems 4–10, use the given normal distribution.
- Name the mean and standard deviation.
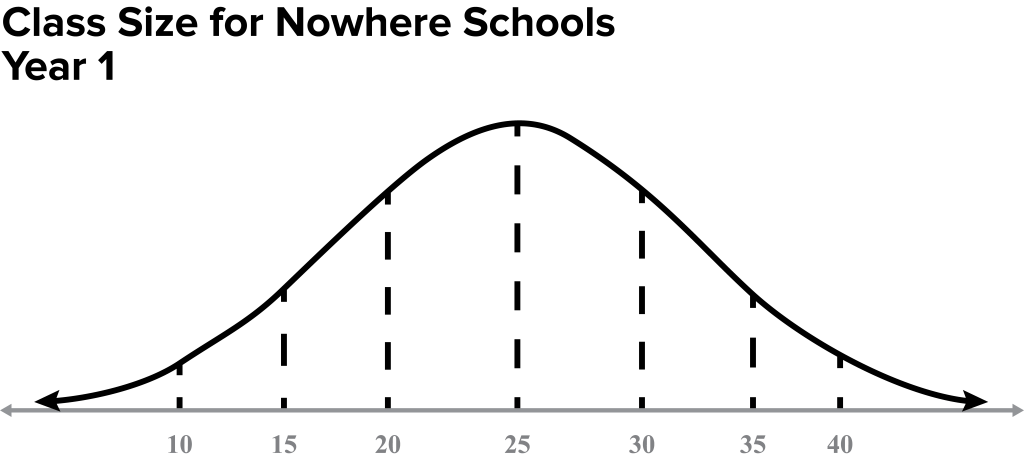
- Determine the percentage of students with a class size on the interval [15, 35].
2 standard deviations
- What is the likelihood that a class contains fewer than 35 students?
- Nowhere Schools want to include the range of students per class so parents know what to expect. What makes the most sense to include on their site (68%, 95%, or 99.7%)? Explain.
Sample: Two standard deviations from the mean, 95%, make the most sense because nearly all classes will have between 15 and 35 students.
- In Year 2, Nowhere Schools hired more teachers and added more classrooms. The average number of students per class decreased to 23 with a standard deviation of 3. Sketch the normal distribution for Year 2.

- Name the interval where 68% of the class sizes occurred for both Year 1 and Year 2.
- Explain how hiring more teachers and adding classrooms affected class size.
Sample: Hiring more teachers and adding more classrooms decreased the average number of students per class. Because the standard deviation is smaller, there is also less variance between class sizes.
Calculate the standard deviation. Round to the nearest tenth.
Note
Completing at least one problem by hand will help you better understand the standard deviation formula. Check solutions using technology.