Modeling Applications Solutions

  • Mathematical    models    of real-life scenarios can be created from tables, graphs, and/or equations.
  • The models do not always match the scenario exactly, but they are close    representations   .
  • They can be used to analyze and predict using    interpolation    and    extrapolation   .

Example 4

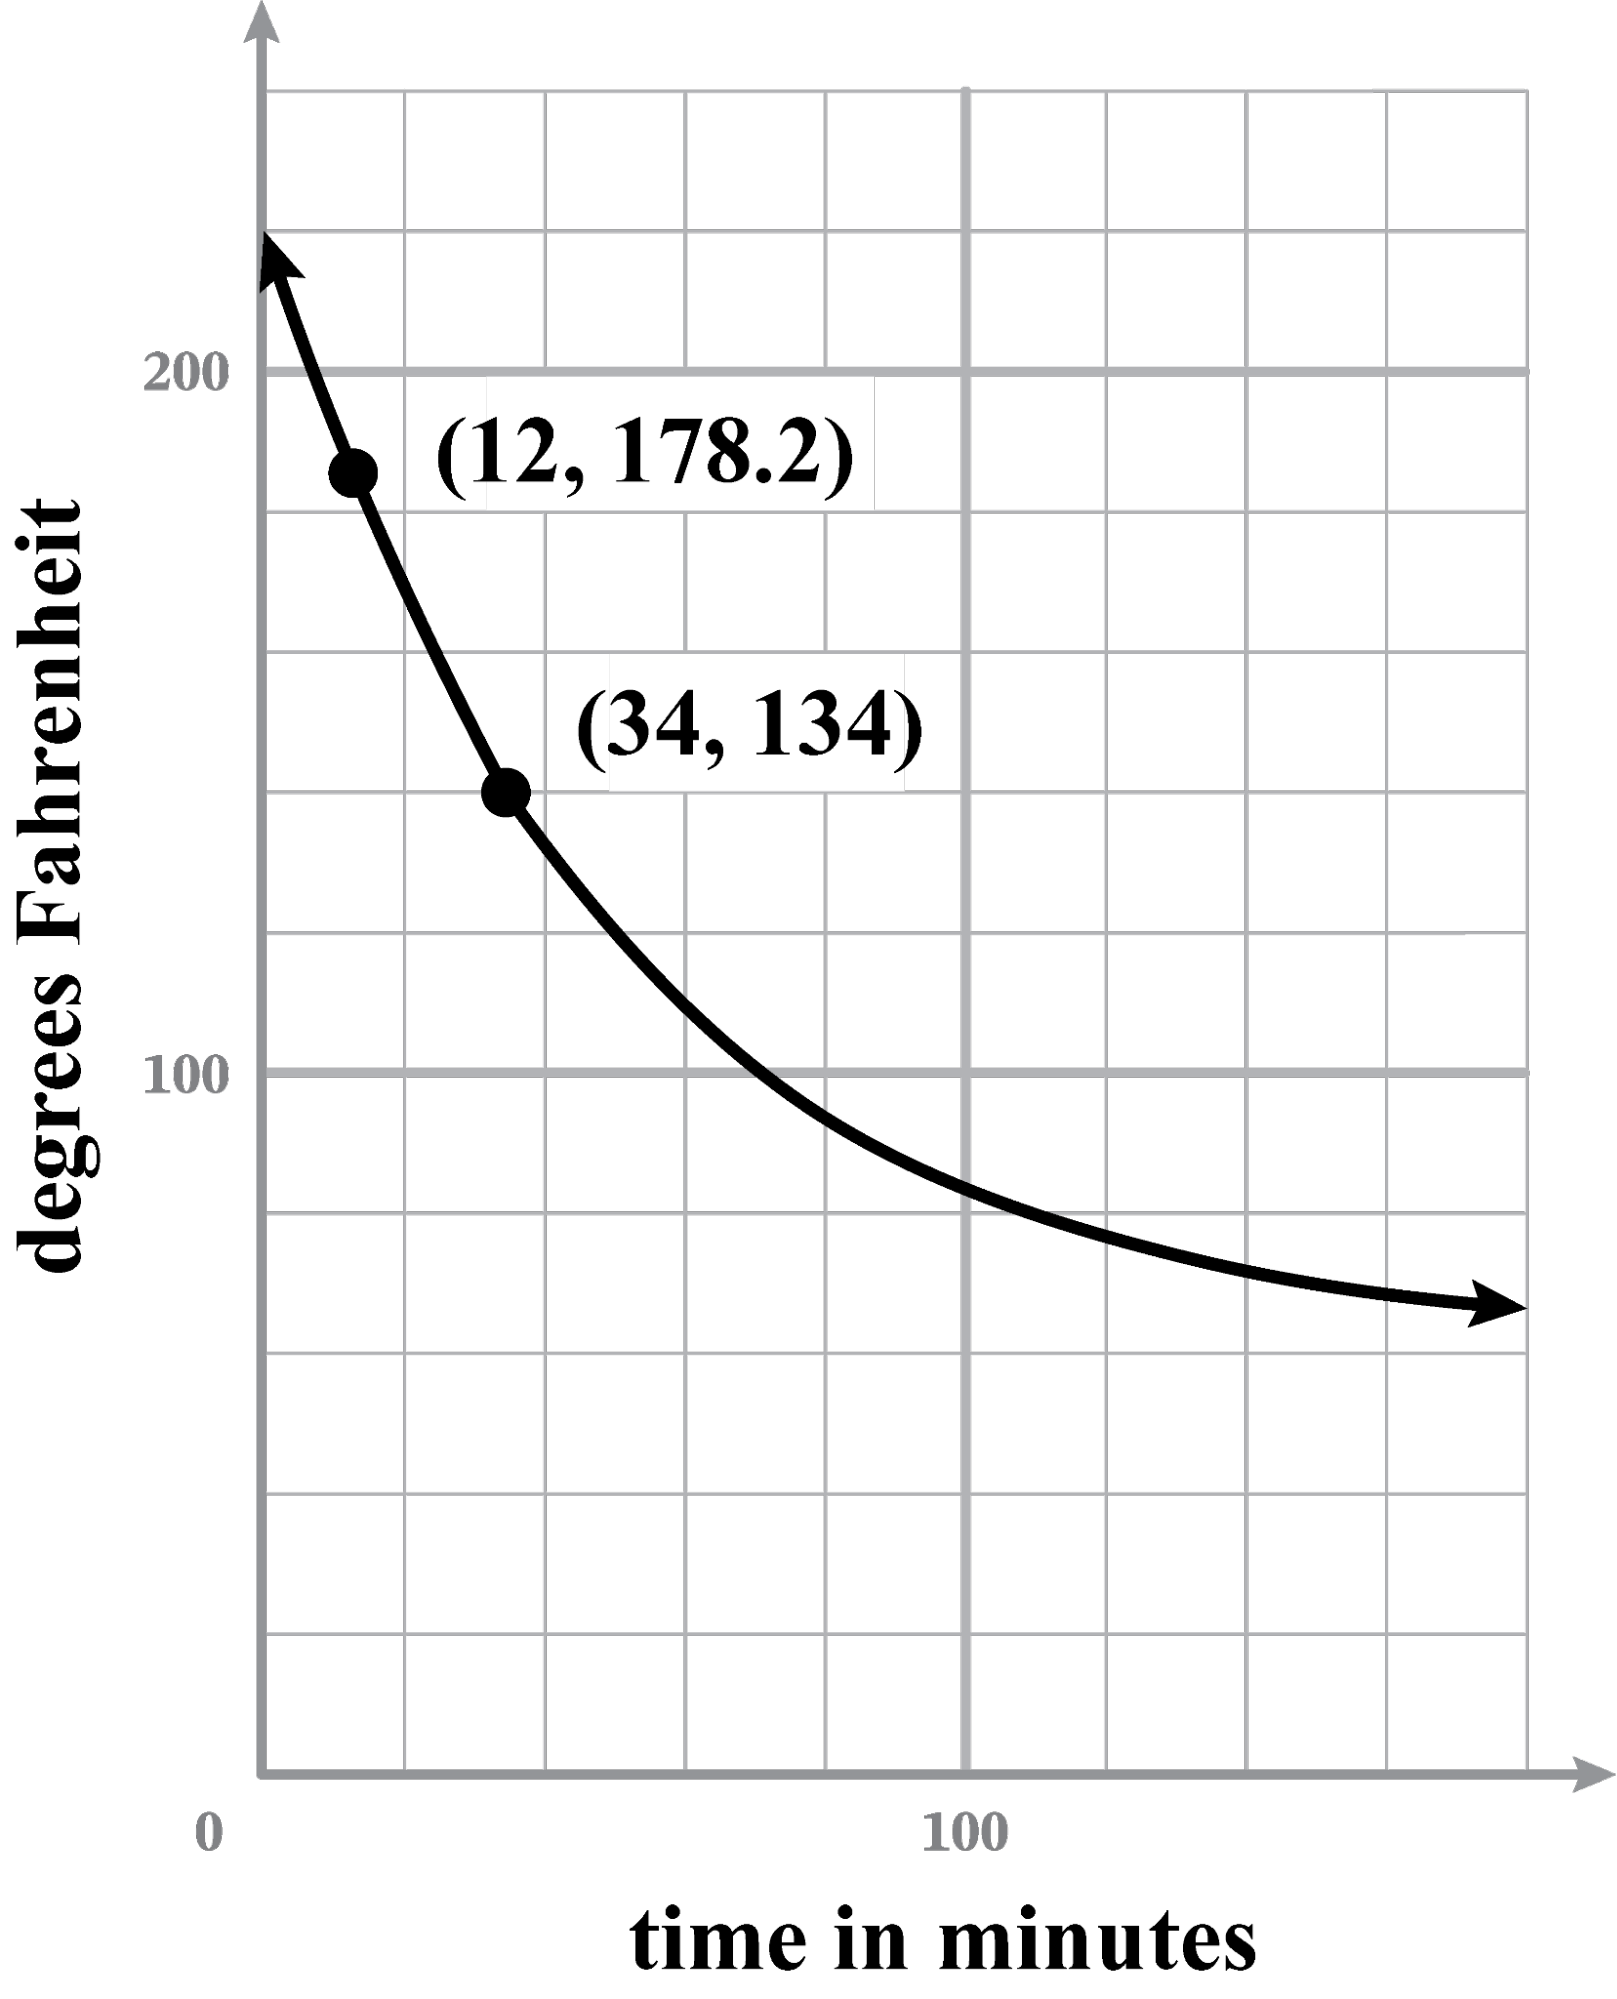
After making a cup of tea at 8 a.m., Rheema decided to measure how quickly it was cooling. She noted two points on an exponential decay graph.

  1. Write an equation to represent the graph of y=abx+55.
  1. At what approximate time will the temperature of the tea reach 66°F?
  1. Find the rate of change between the given points.
  1. (12, 178.2), (34, 134)     y=abx+55134=ab34+55  79=ab34    a=79b34

y=abx+55y=79b34bx+55178.2=79b34b12+55123.2=79b22123.2b22=79b2222=79123.222b=0.98a=790.9834=157.01157

 y=1570.98x+55

  1. y=1570.98x+5566=1570.98x+5511=1570.98x11157=0.98xlog 11157=log 0.98xlog 11157=xlog 0.98x=log 11157log 0.98=131.58

131.58132 minutes60 minutes = 1 hour13260=2.2 hr

At approximately 10:12 a.m., the tea reaches 66°F.

  1.     m=y2y1x2x1=178.21341234=44.2222.009 
Note

Q: Does the rate of change in part C represent the changing temperature for the entire graph?

A: No, because the rate of change is linear. It represents the section of the graph between 12 and 34 minutes, but not the entire graph.

Customer Service

Monday–Thursday 8:30am–6pm ET