Graphing Logarithmic Functions without Technology Solutions
Because the graph of a logarithmic function, , is the inverse of an exponential function, :
The graph is reflected across
The asymptote is the vertical line
There is an x-intercept, , but no y-intercept
The domain is:
The range is:
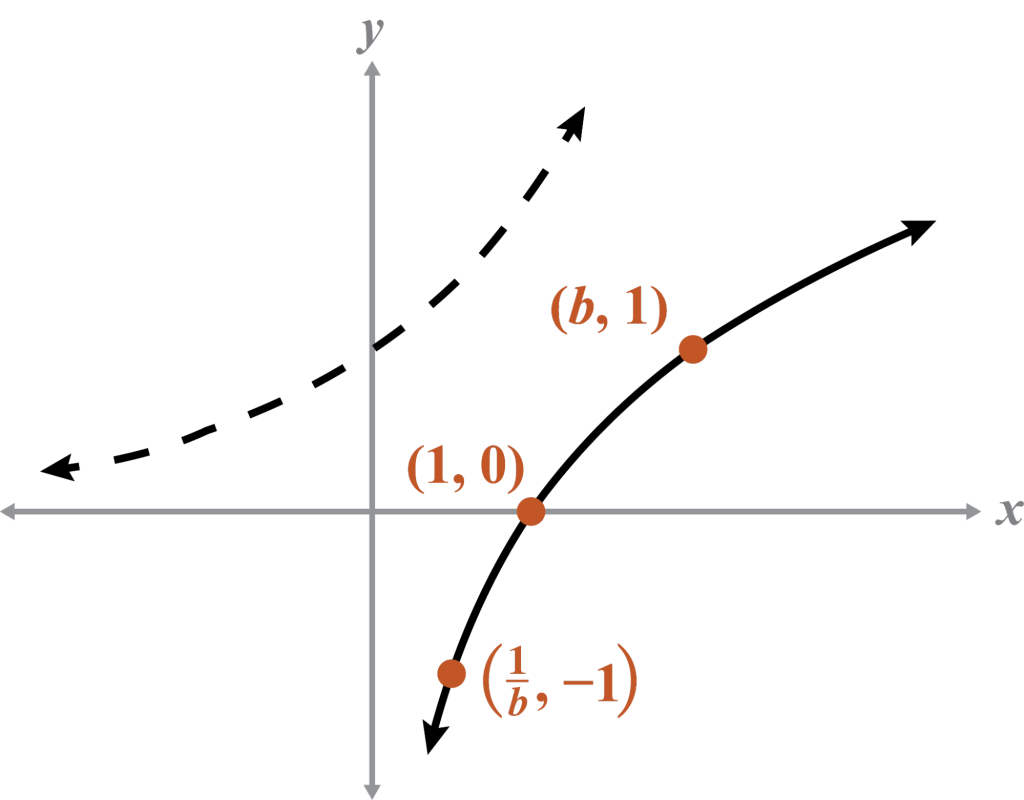
A sketch of the exponential function as a dashed graph can help visualize its inverse, the logarithmic function.
Increasing Function
End behavior: As and as
x
y
b
1
1
0
–1
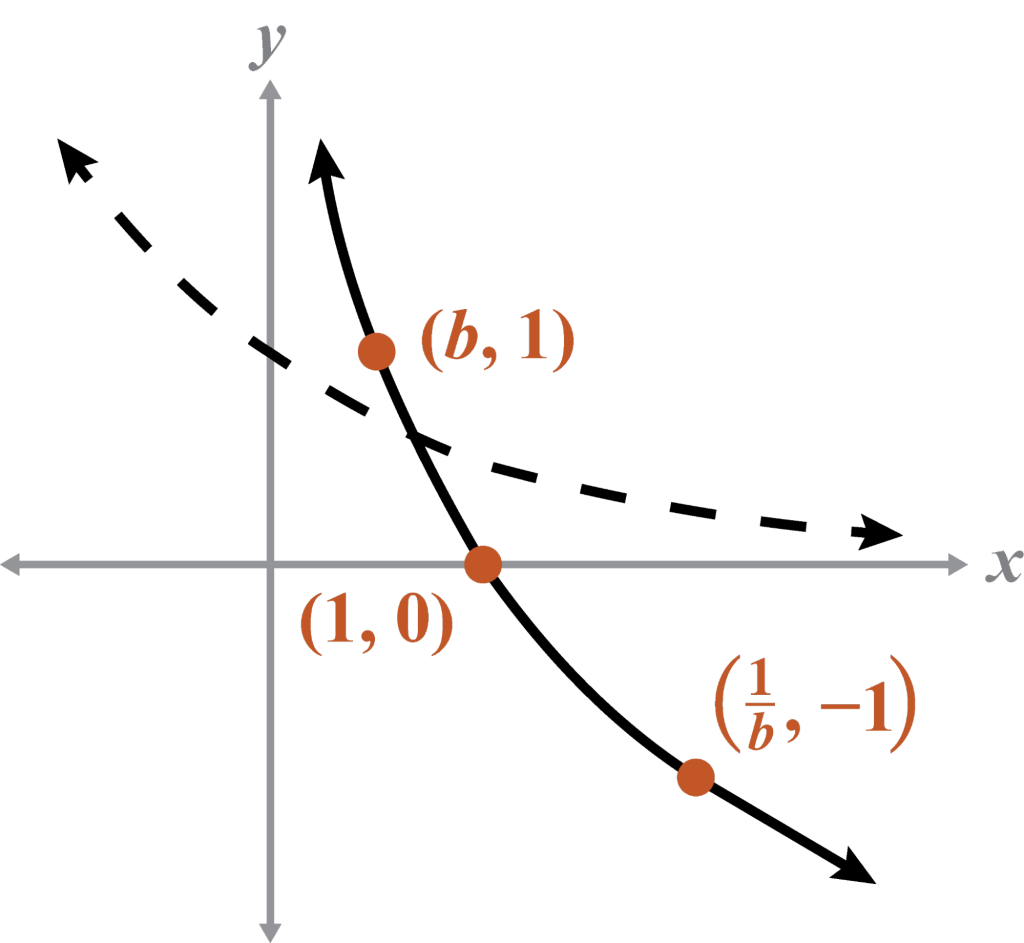
Decreasing Function
End behavior: As and as
Because the value of most logarithms results in an irrational number, it is sometimes necessary to work with the inverse of the function.
Then you can compare the log and the exponential functions.
When graphing a logarithmic function without technology:
Rewrite it as its inverse.
Make a table of rational values .
Interchange the x- and y-values from the table.
Graph the logarithm .
Note
In the next few examples, you will graph simple logarithms from a table. In the next section, you will sketch more complicated graphs using technology.
Example 3
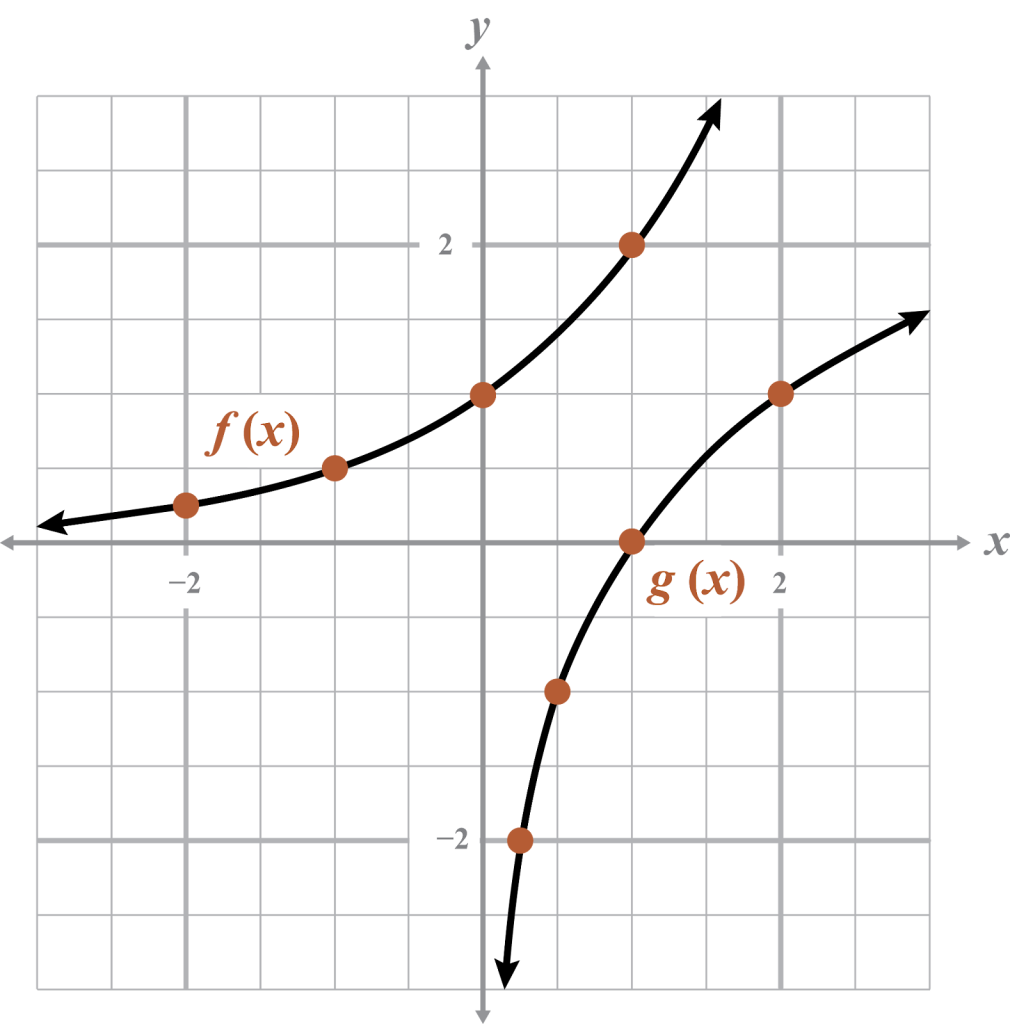
Compare f(x) and g(x).
x
–2
0.25
–1
0.5
0
1
1
2
2
4
Domain:
Range:
Asymptote:
x
0.25
–2
0.5
–1
1
0
2
1
4
2
Domain:
Range:
Asymptote:
f(x) and g(x) are inverses because their ordered pairs are switched, and the graph of g(x) is reflected over y = x .
Example 4
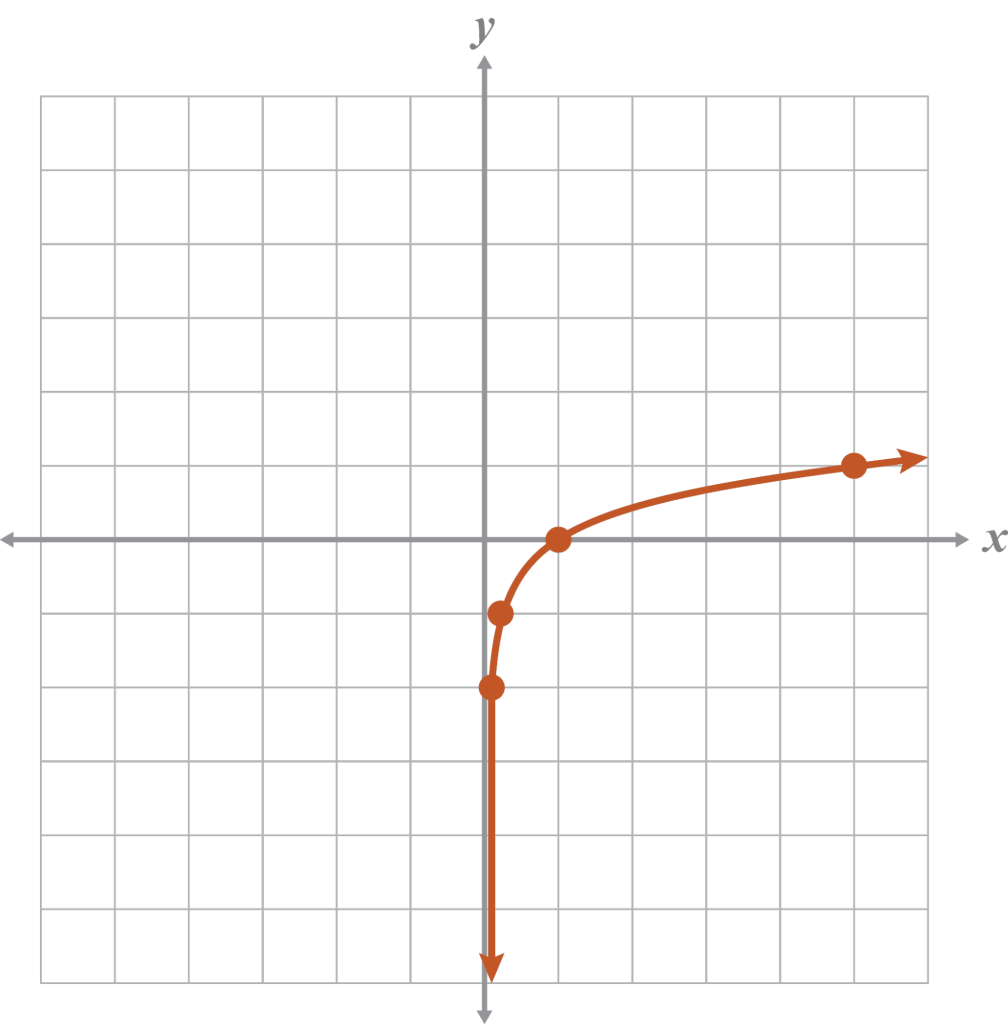
Graph without technology. Describe the end behavior and the domain and range.
Plan
Write the inverse Make a table for the inverse Switch the points Graph
x
–2
–1
0
1
(1, 0)
1
5
(5, 1)
2
25
(25, 2)
Note
Even if all of the points in your table do not fit on the given coordinate plane, they can help you picture the general shape of the graph.
Explain
End behavior: As , and as ,
Domain:
Range:
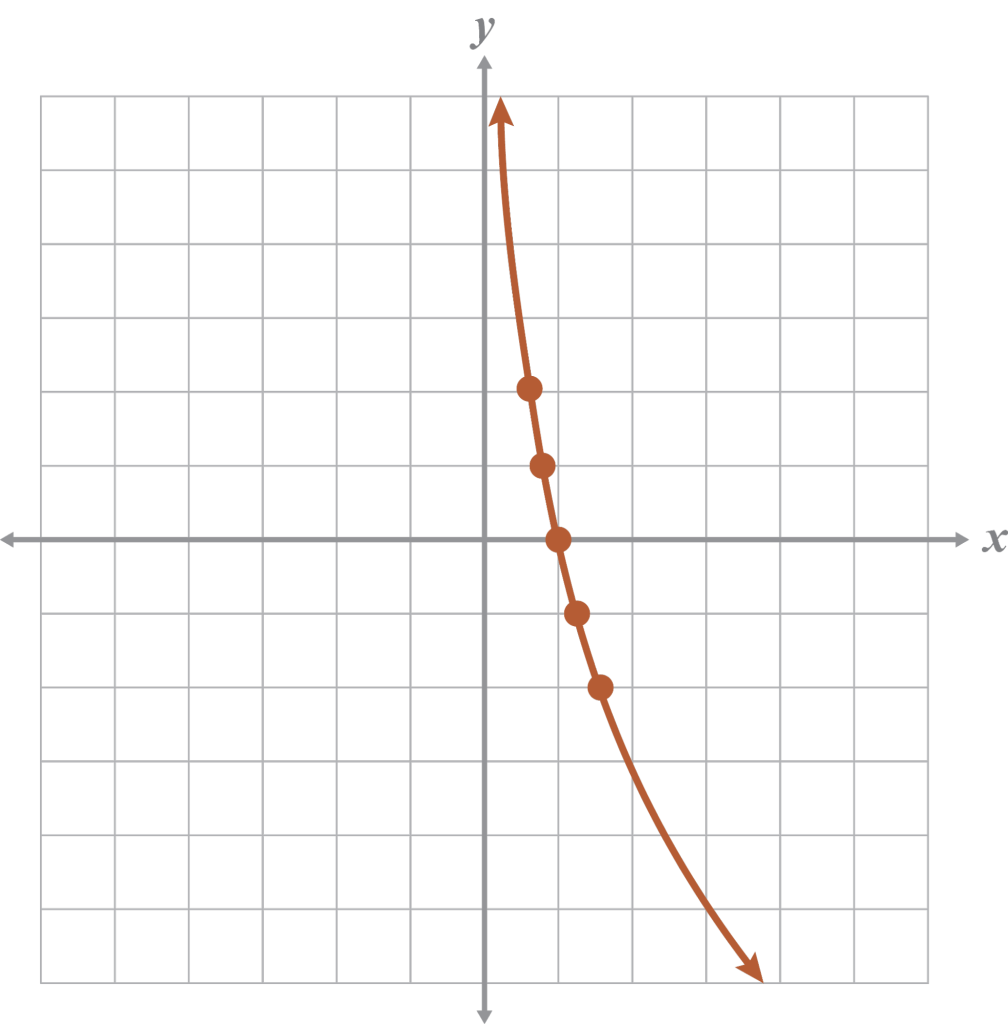
Example 5
Graph the inverse of the given equation without technology. Describe the end behavior.