
Explore
Graphing Exponential Functions Solutions
Pay attention to compared to Without parentheses, the problem would read which would mean the base is not negative.
Recall that when an exponent is negative, take the reciprocal of the base.
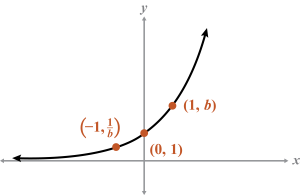
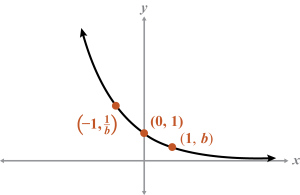
| Growth Function | Decay Function |
 |
 |
|
Asymptote: y = 0 (x-axis) End behavior: As and as |
Asymptote: y = 0 (x-axis) End behavior: As and as |
|
Domain: Range: |
|
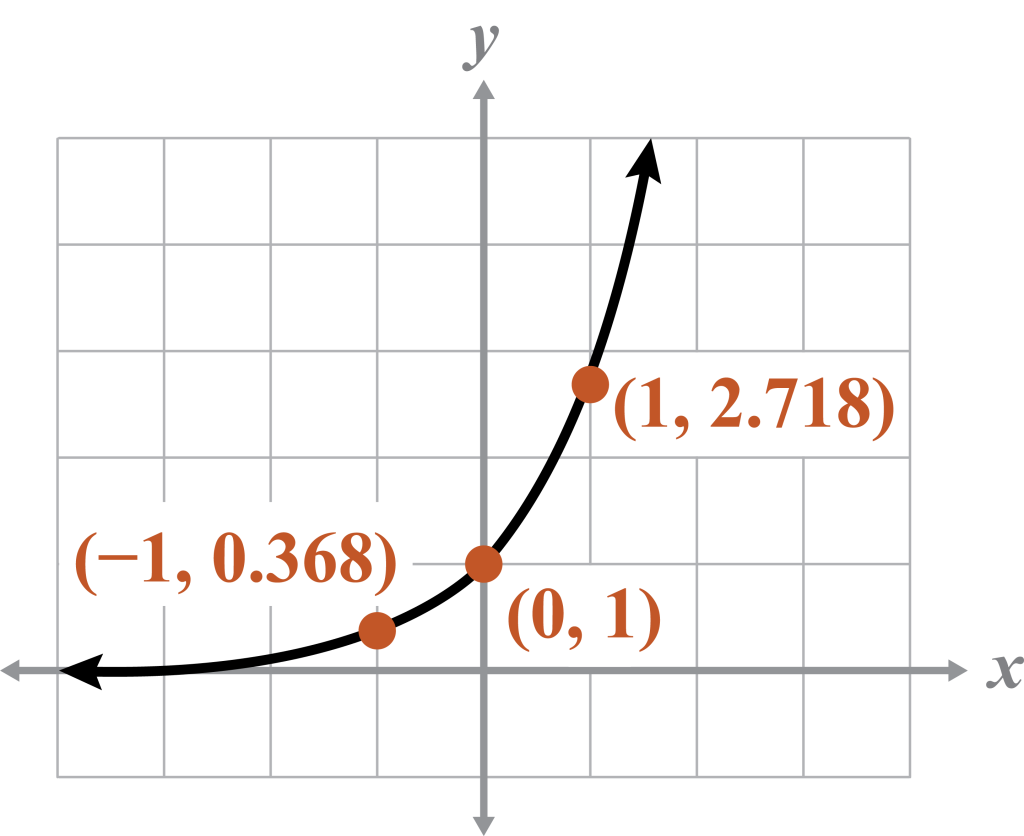
It is recommended that you use a calculator when working with e.
Note
e is defined as
Example 1
Name the value of b and if it represents growth, decay, or neither.
Note
Remember e is an irrational number.
| Exponential Growth | Exponential Decay | Neither |
| These functions represent exponential growth because | These functions represent exponential decay because | These are not exponential functions because or b is a negative value. |
Example 2
Graph both functions on the same coordinate plane. Name the end behavior and the domain and range.
Note
The negative power tells you to take the reciprocal of the base before determining if the graph will be a growth or decay function. Remember, both graphs have an asymptote at
| x | f(x) | g(x) |
Domain: Range: |
| –1 | |||
| 0 | 1 | 1 | |
| 1 | 5 |
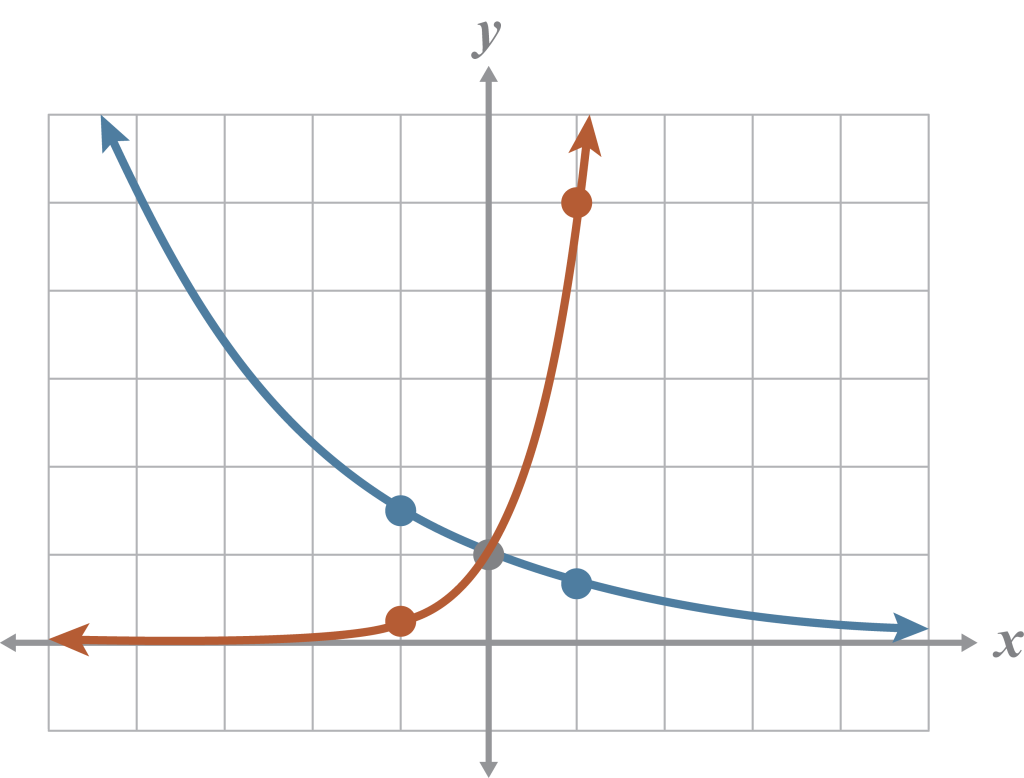
As and as
As and as