
Mastery Check Solutions
Show What You Know
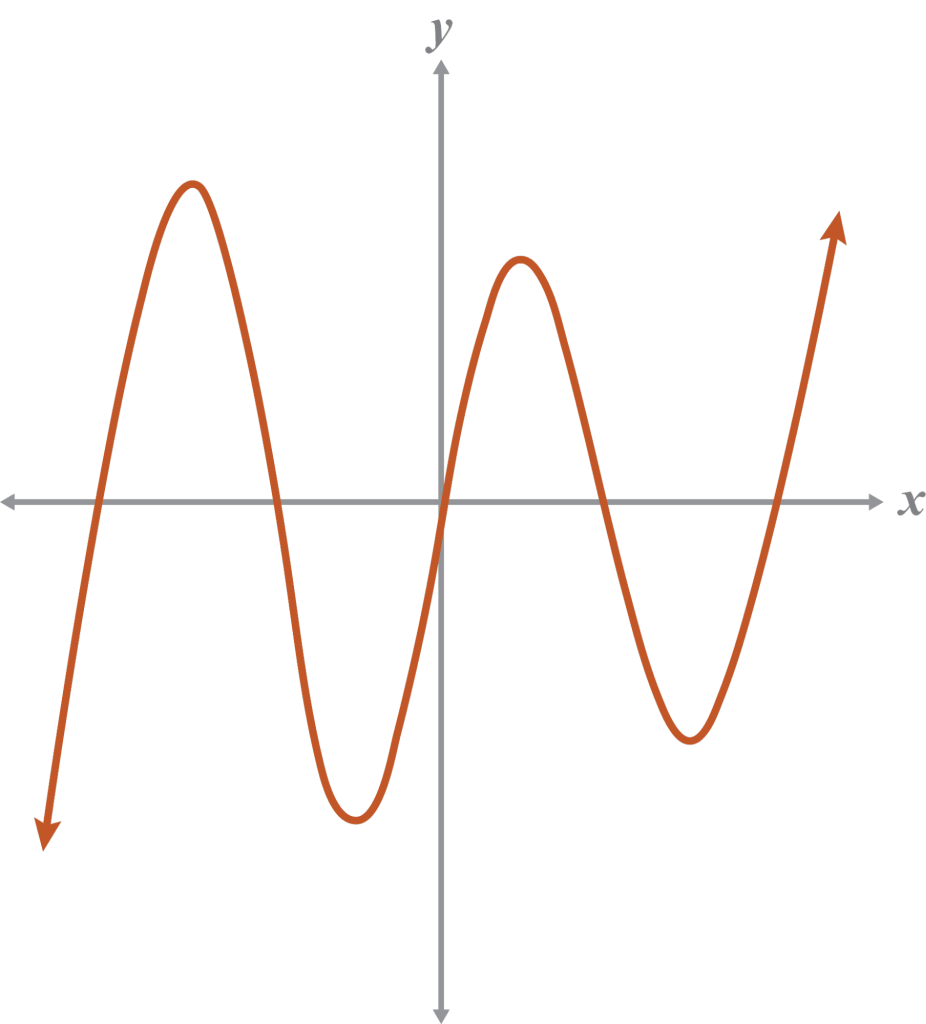
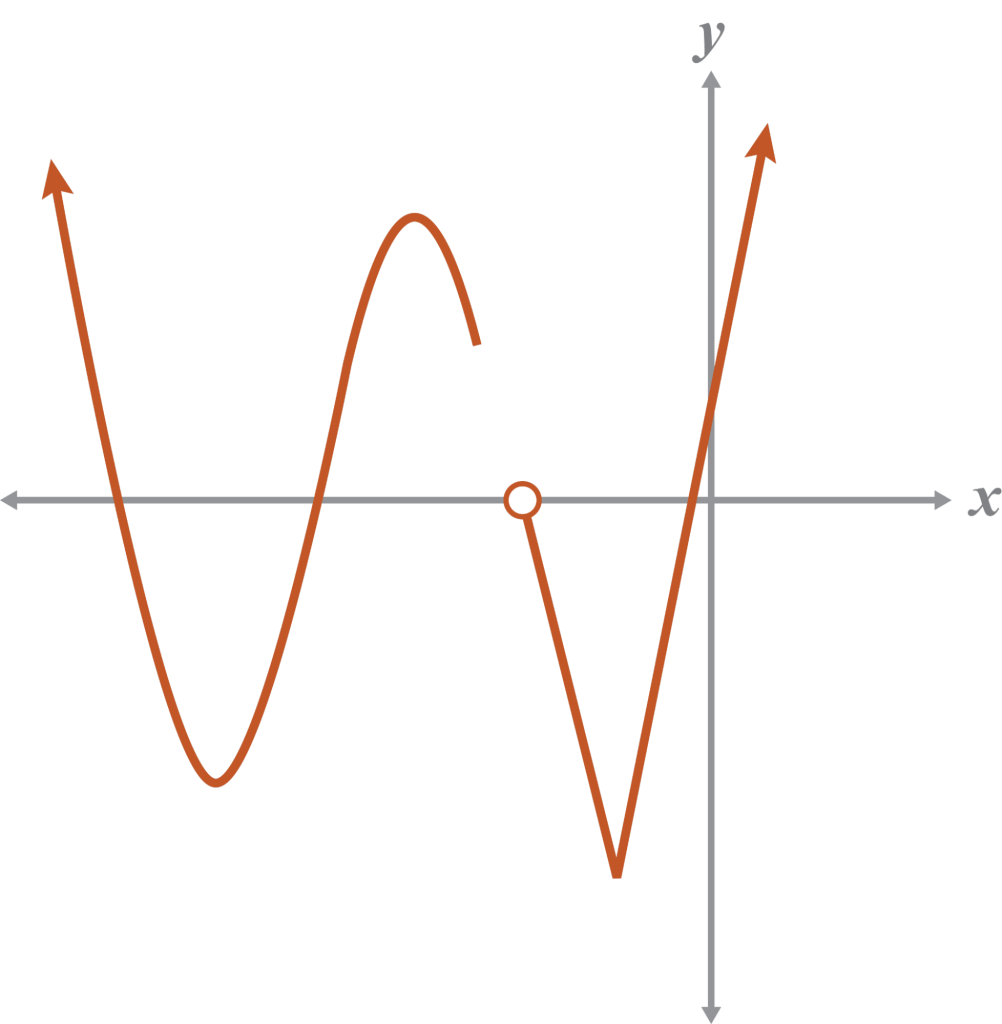
- Sketch an example and counterexample of a polynomial function.
Sample example
Sample counterexample
Note
Does your sketch represent an even or odd function? Is the leading coefficient positive or negative?
- Explain your response to part C.
Polynomial functions have coefficients that are real numbers. Real numbers include the subsets of rational or irrational numbers. Rational numbers also include the subsets of integers, whole numbers, and natural numbers.
Note
Your student can review the real number diagram if they do not recall the subsets of real numbers.
The leading coefficient test allows you to generalize the end behavior of a function using the leading coefficient a and the degree n.
- Determine if the degree of the function is even or odd and if the leading coefficient is positive or negative. Then generalize the end behavior.
|
Sketch 1
|
Sketch 2
|
Sketch 3
|
Sketch 4
|
|
even |
odd |
odd |
even |


Note
While it may seem repetitive to write out the end behavior, it is critical to developing an understanding of how polynomial functions, their leading coefficient, and degree all work together.
Say What You Know
In your own words, talk about what you have learned using the objectives for this lesson and your work on this page.
Note
Restate the objectives of the lesson in your own words. If you are unable to restate the lesson objectives, go back and reread the objectives and then explain them.
- Determine the type of function (polynomial, power, both, neither) represented by equations or graphs.
- Describe the end behavior using a graph or equation, including the domain and range.