
Graphing Systems of Non-Linear Inequalities Solutions
Example 4
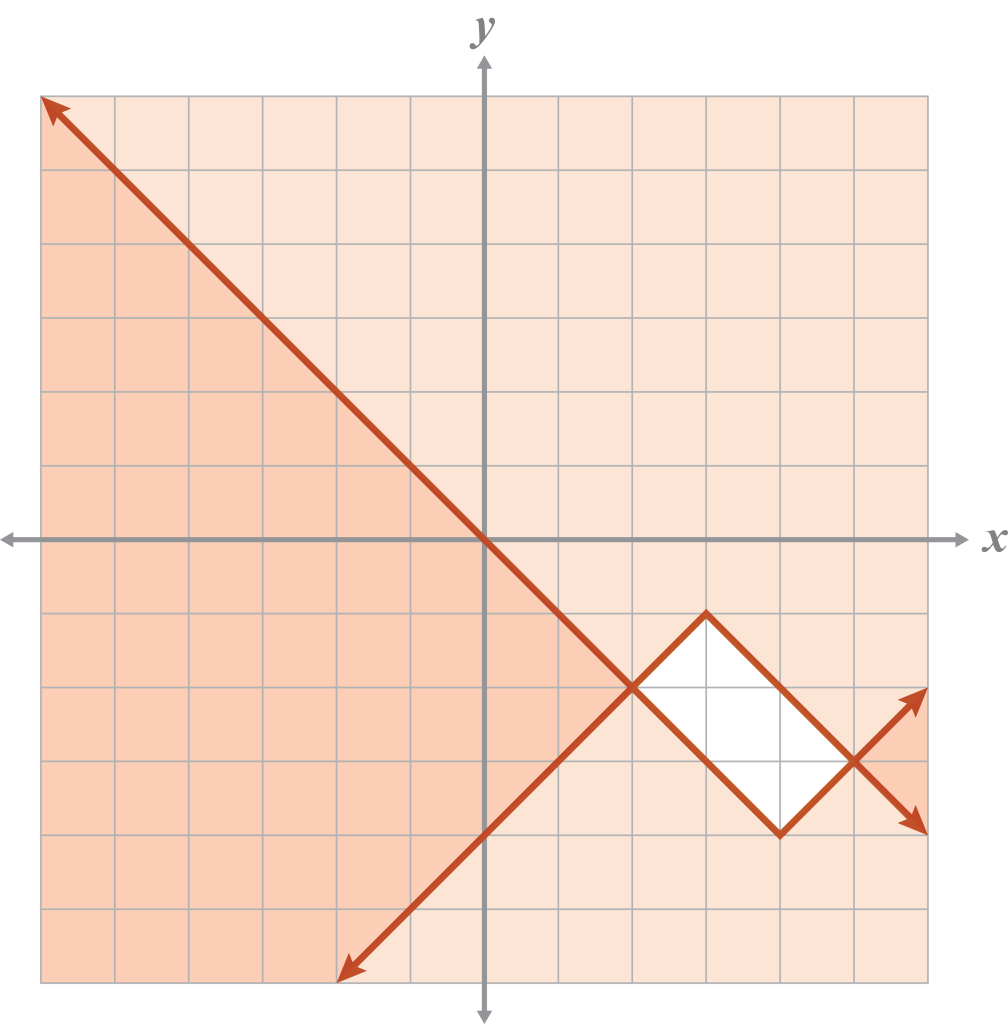
Graph the system of inequalities.
This system has no solution because there are no shared ordered pairs in the shaded regions.

no solution
Note
Saying your plan out loud may be helpful in getting started.
Remember that square root equations and inequalities have a vertical asymptote, and this restricts the solutions.
Use a test point if you are not sure where to shade. The ordered pair must be true for every inequality in the system.
Example 5
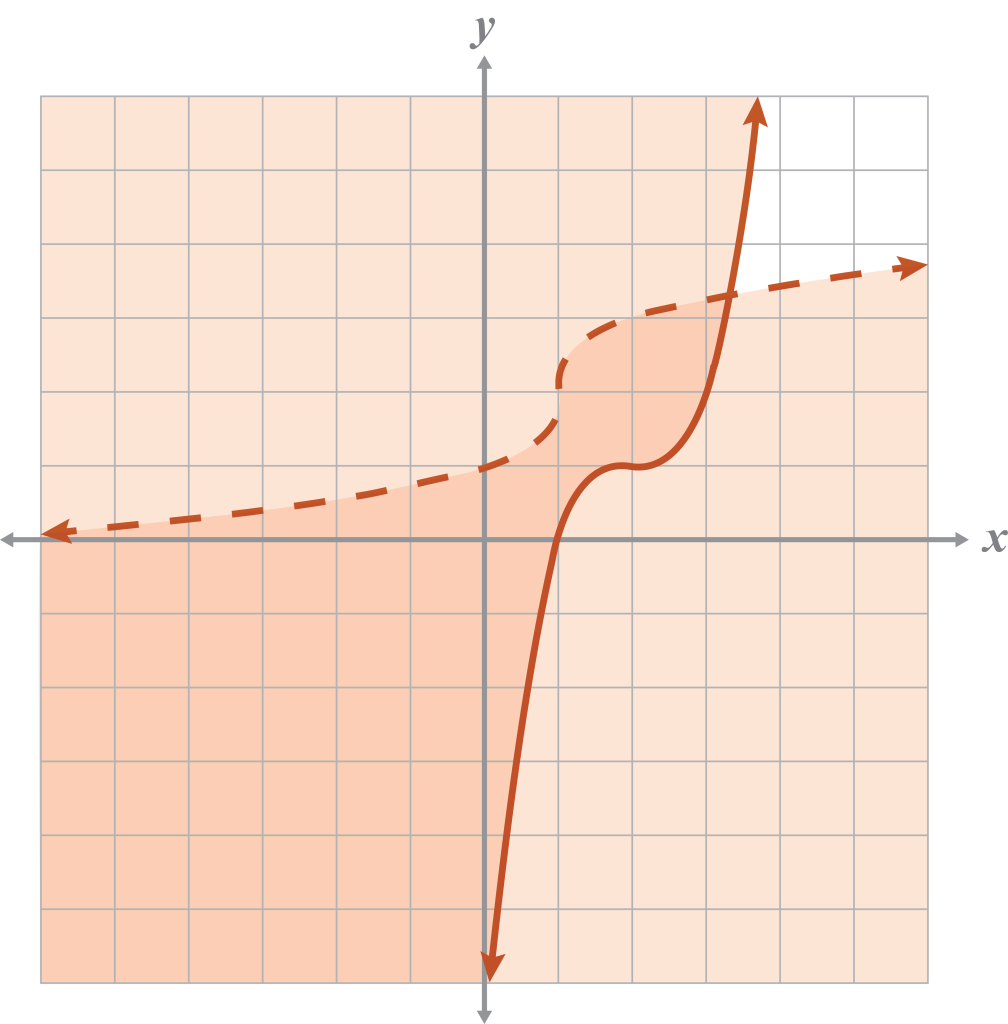
Graph the system of inequalities.
Example 6
Graph the system of inequalities.

Example 7
Graph the system of inequalities.
Note
All of these graphs can also be checked using technology.