
Piecewise Scenarios Solutions
Note
Even more complex scenarios exist. You can learn about them in precalculus and above (i.e., discontinuous and continuous graphs).
Example 8
The community center is selling tickets for their upcoming concert. The table shows the ticket prices based on the ages of the concert-goers. Create a graph that represents the ticket prices for the concert. Write a piecewise function to represent the table and graph.
| age | price |
| 0-5 | free |
| 6-15 | $10 |
| 16-60 | $15 |
| 61+ | $12 |
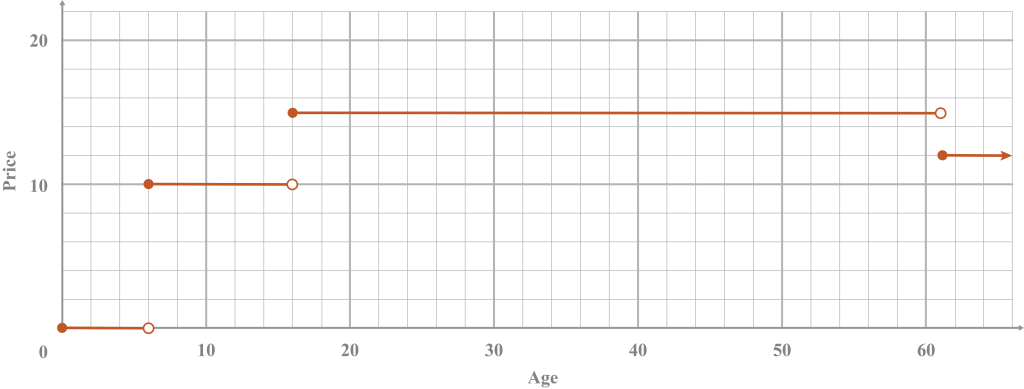
(age, ticket price)
Note
Q: How do you determine where the open and closed points belong?
A: decide if it is a floor or ceiling problem
Q: Why is the upper number (open circle) one more than the age?
A: You cannot be two ages at the same time
Example 9
A physics class was using a toy car track to learn about the relationship between kinetic and potential energy. The graph of the ramp shows the relationship between the vertical and horizontal distances in inches.
(horizontal distance, vertical distance)
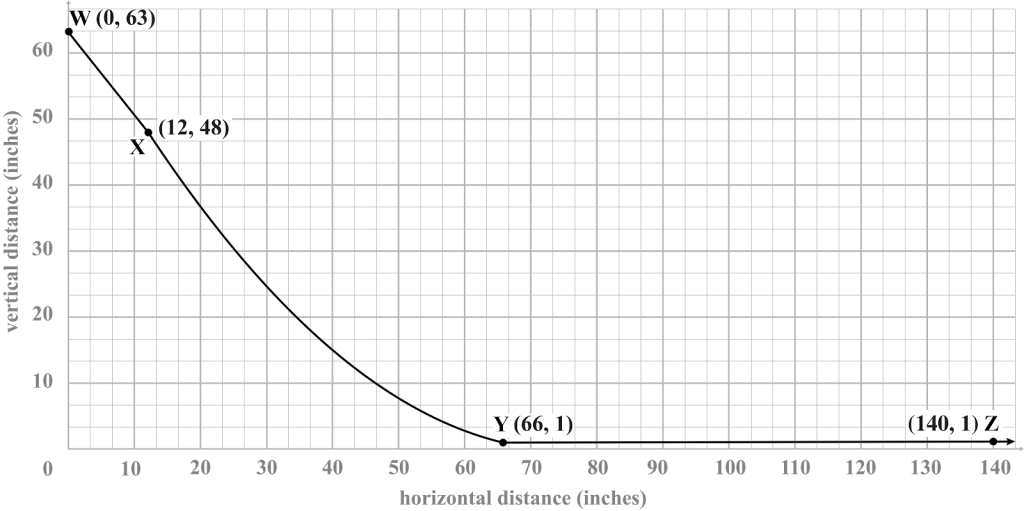
- Find the rate of change between points W and X.
-
Estimate the rate of change between points X and Y.
The graph between points X and Y is a curve, but the rate of change can still give an estimate of what is happening over time.
Note
You will learn how to find the exact rate of change in calculus.
- Find the rate of change between points Y and Z. Explain why this slope does not mean that the toy car is stopped.
A slope of zero means that the track is flat on the ground. It does not mean that the car is stopped because the graph is not comparing distance and time.
-
What is the steepest part of the ramp? Explain.
The steepest part of the ramp is between points W and X because the absolute value of this slope is greater than one.
Note
This problem is broken down into four parts; however, part D could be the only question asked. In that case, you would need to find the slope for each part of the graph in order to answer the question completely.