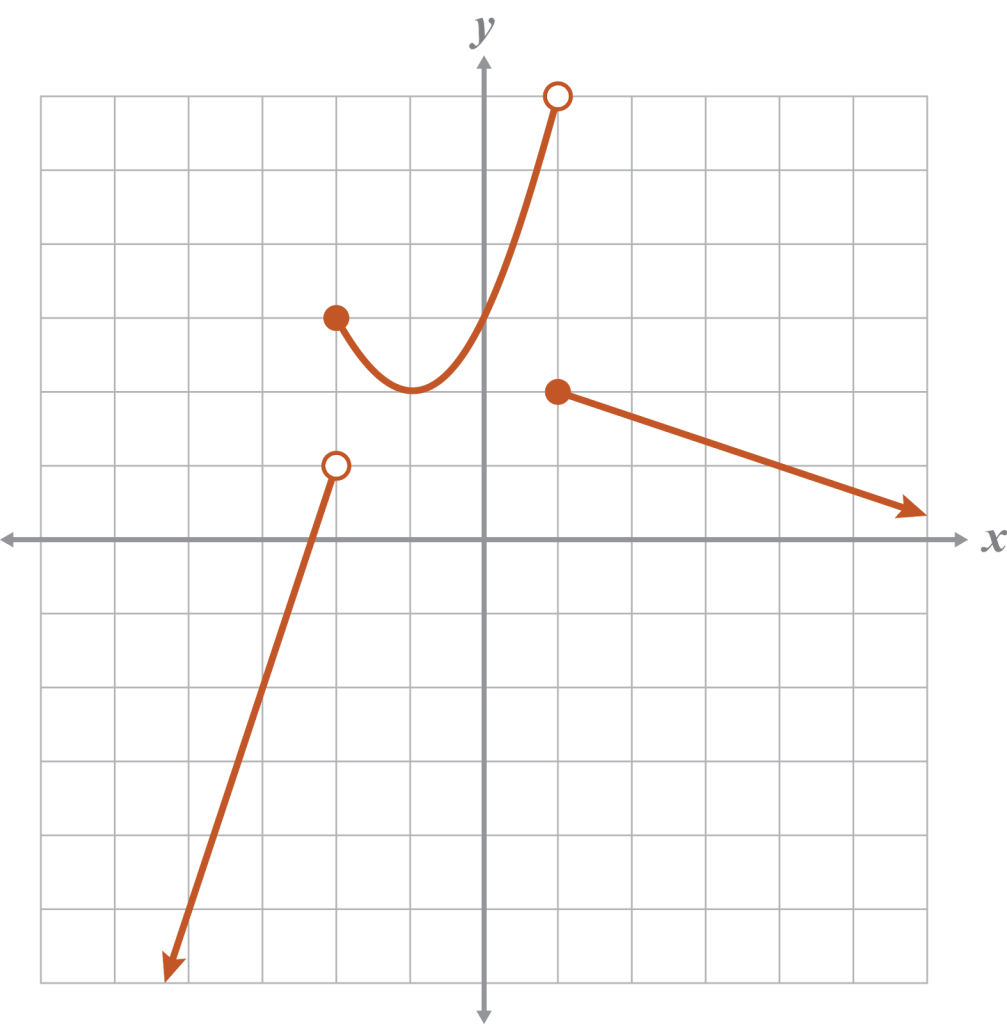
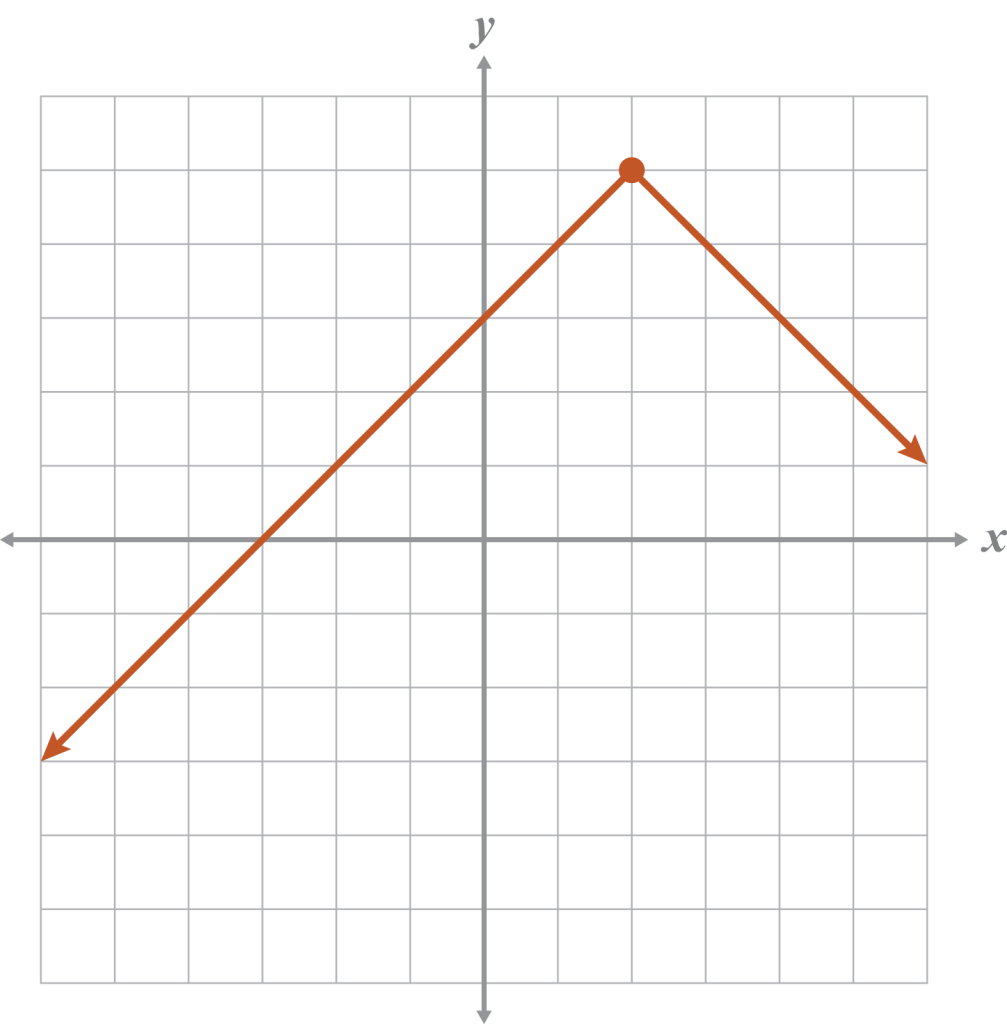
Graphing Piecewise Functions Solutions When graphing a piecewise function, use what you know about transforming parent functions to mark open and closed points that note endpoints . The specific domain intervals beside each expression in the function determine: the open and closed points on the graph. what expression is graphed over that domain interval. Example 4 Graph. y=x+12 + 2if –2≤x<1–13x–1 + 2if x≥13x+7if x<–2 Example 5 Graph. hx=x+3if x<25if x=2–x+7if x>2 hx=–x–2+5