
Practice 1 Solutions
Name the area for the standard normal curve as a proportion and a percent.
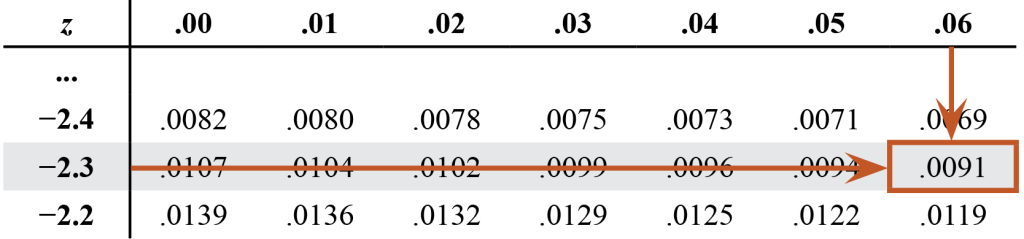
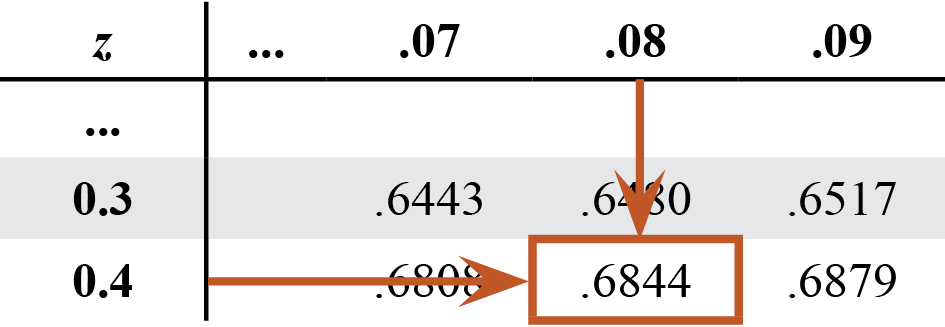
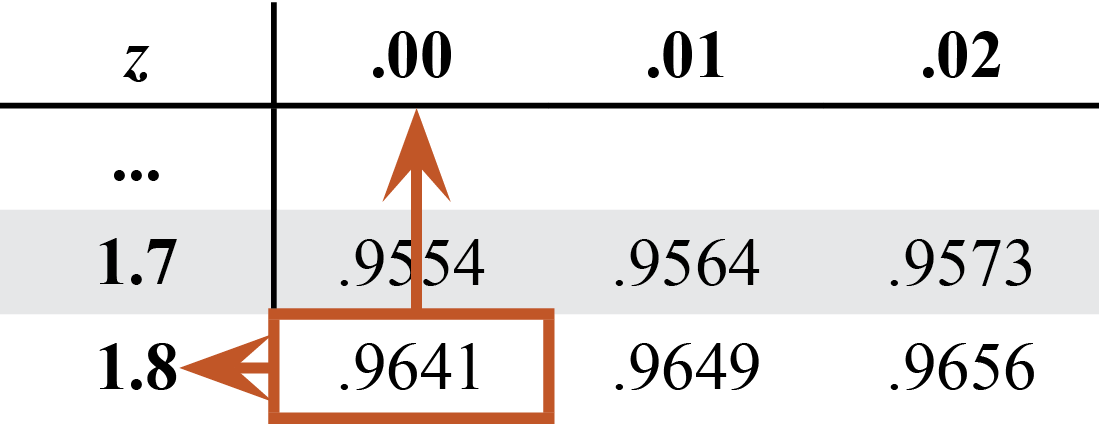
Determine the z-score given the proportion.
- 0.9642
- 0.1207

For problems 5–6, determine the missing value in the formula Round to the hundredth.
Note
Q: What does a negative z-score tell you about the data?
A: It is below the mean.
For problems 7–10, calculate the z-score. Then determine the proportion or raw data score.
After measuring the length of the fish population to stock a lake, a fisheries biologist calculated the average length to be 10.12 centimeters and the standard deviation to be 1.57 centimeters.
Note
You can write your answers as a statement of proportionality, as shown, or in a sentence.
Q: How do you find the proportion, or area?
A: Locate the z-score on the z-table.
- What proportion of fish were between 7.5 centimeters and 11 centimeters in length?
Note
Q: Why must the smaller area be subtracted from the larger area?
A: Area is always a positive value.
- What proportion of fish were longer than 11.5 centimeters?
- What length would represent 93% of the fish in the lake?
The length of 93% of fish will be 12.44 centimeters or less.
For problems 11–14, use the scenario.
The media corporation, Time Inc., collected data on employee travel time from home to work in minutes. The average commute time was 20 minutes, and the standard deviation was 5 minutes.
- How long is the commute for 90% of Time Inc. employees?
The commute is about 26 minutes or less for 90% of employees.
- What proportion of employees have a commute of 10 minutes or less?
- What is the maximum expected commute time for 6% of employees?
The maximum commute time is about 12 minutes for 6% of employees.
Note
Q: What variable are you solving for in the formula?
A: X
- Determine the proportion of employees who have a commute between 15 and 20 minutes at Time Inc.
Note
Q: What percentage above or below the mean is one standard deviation?
A: 34%
Q: How does 34% relate to this problem?
A: A commute between 15–20 minutes is one standard deviation below the mean.
For problems 15–16, use the scenario.
The average typing speed for fifteen-year-olds at Barnesville High is 36 words per minute (wpm), and a standard deviation of three words per minute.
|
Typing Speed (wpm)
|
|||
|
41
|
30
|
35
|
38
|
|
33
|
39
|
37
|
34
|
|
38
|
36
|
32
|
35
|
- Complete the table to determine if the sample group of students represents a normal data set.
|
z
|
–2
|
–1
|
0
|
1
|
2
|
|
Area < z
|
0.02
|
0.16
|
0.5
|
0.84
|
0.98
|
|
Predicted: 12z
|
6
|
|
|
||
|
Actual Count
|
0
|
2
|
6
|
10
|
12
|
- Is the sample normally distributed? Explain.
Sample: The sample is normally distributed because the predicted number of data points and the actual number of data points are nearly identical.
Note
If the data is mostly above/below the mean, it is skewed rather than normal.