
Graphing Reciprocal Functions Solutions
Example 6
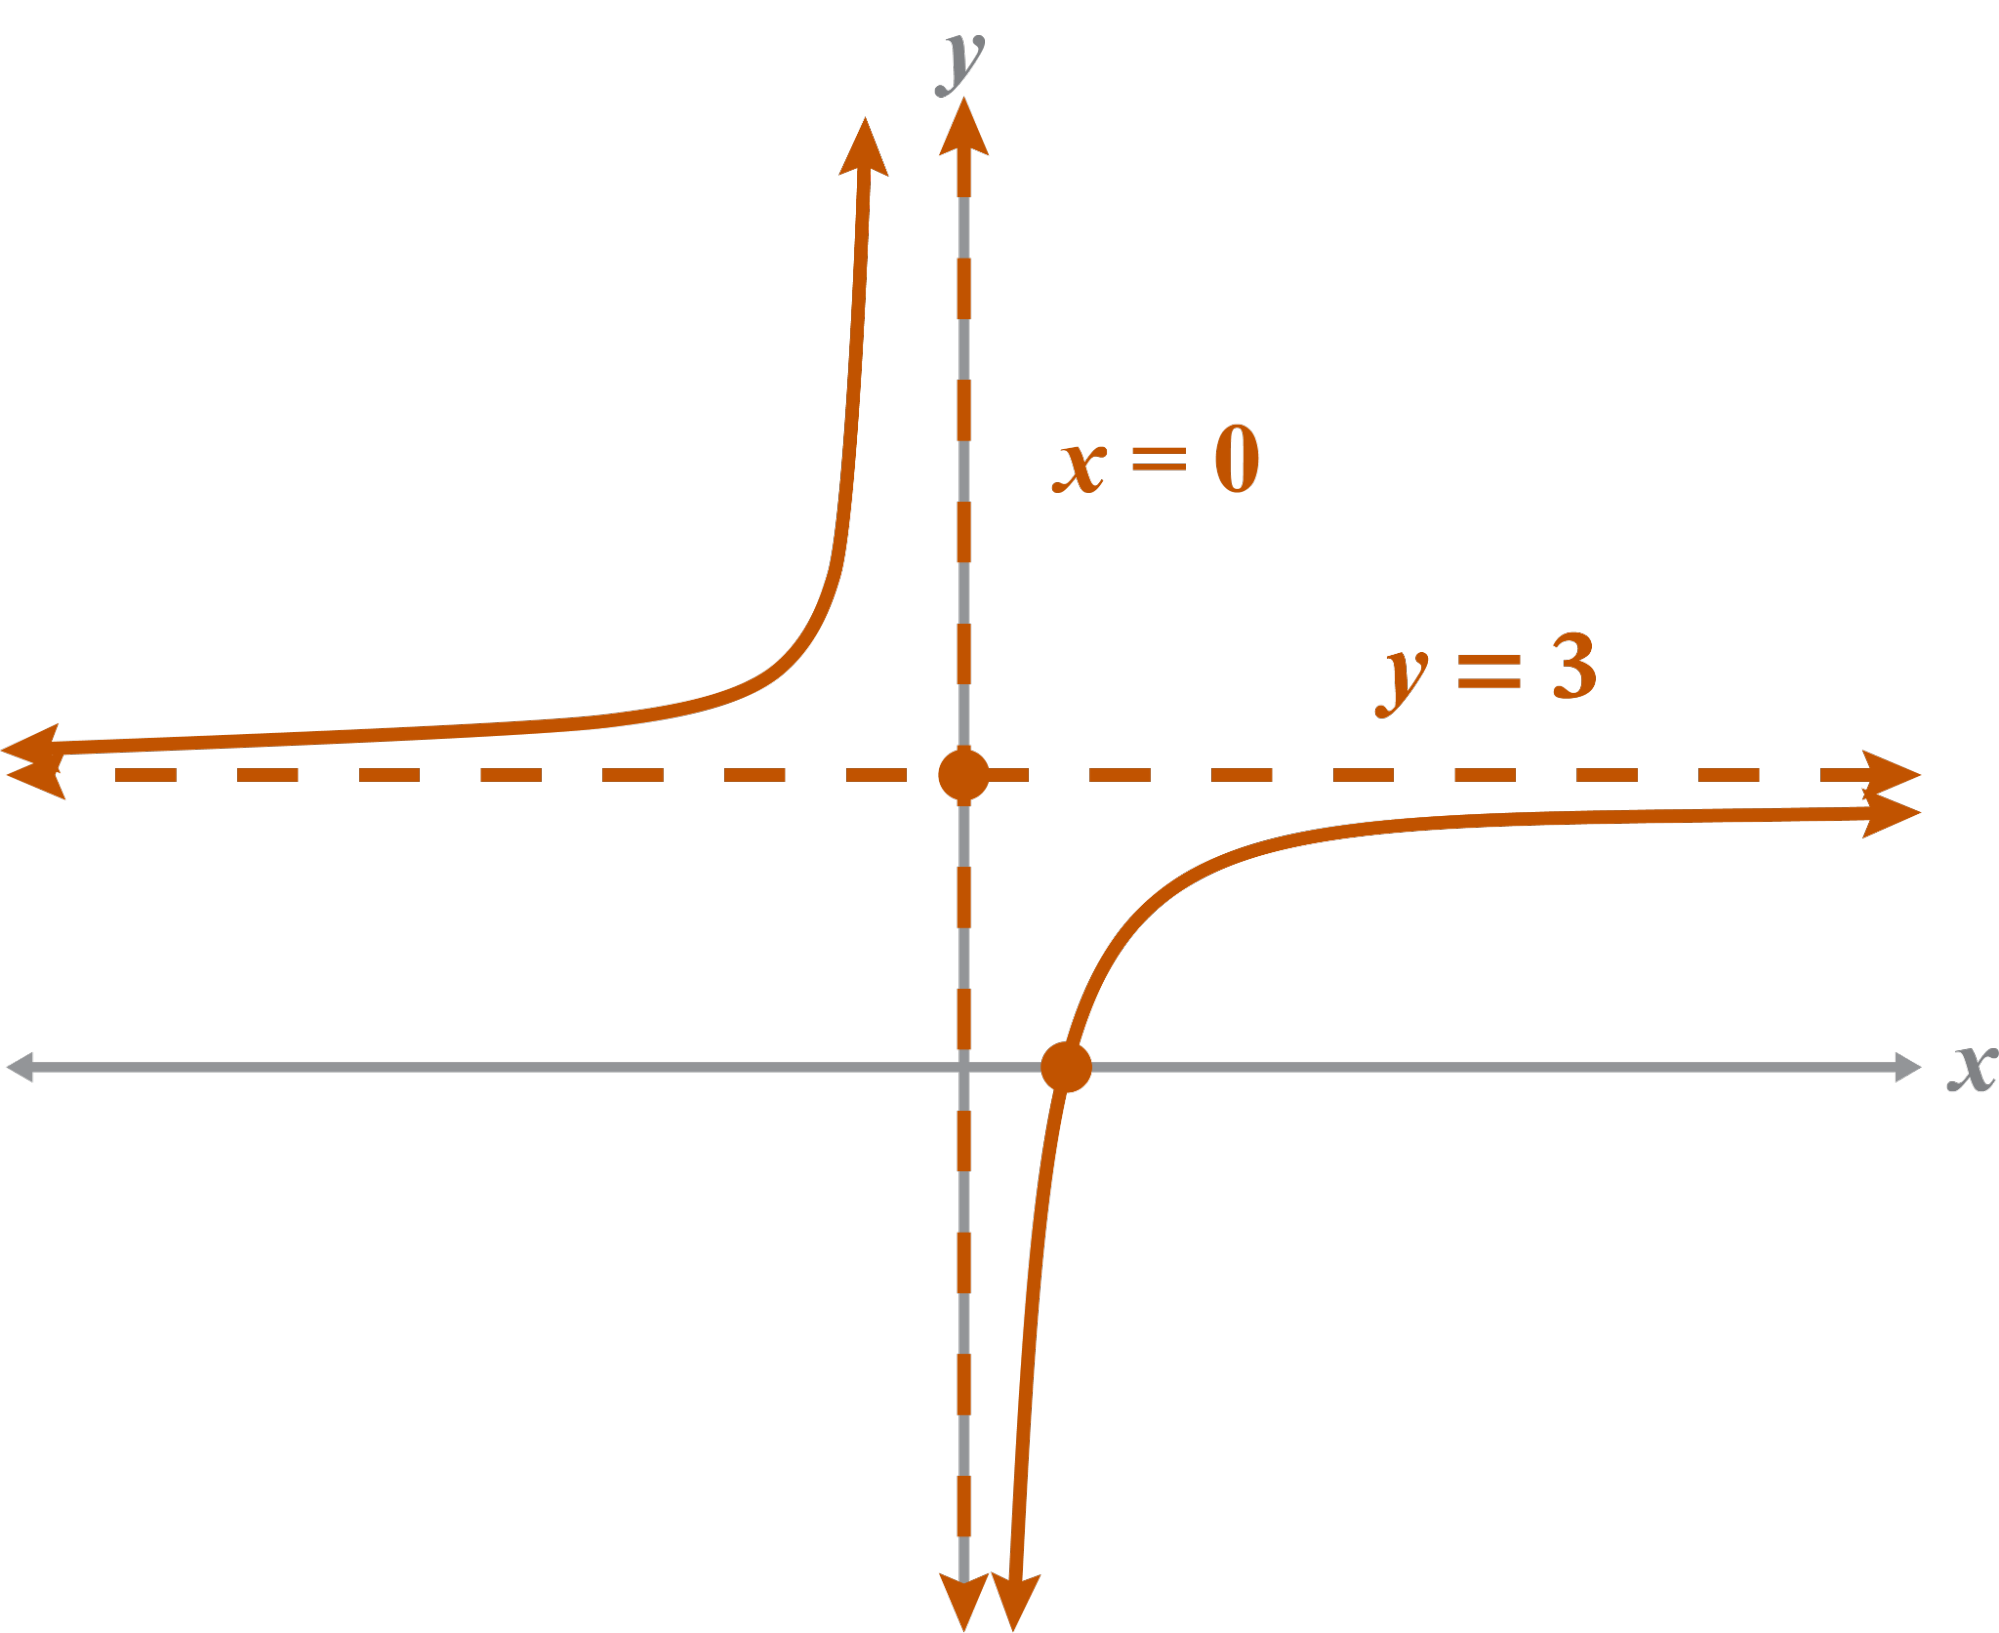
Graph the asymptotes and intercepts. Sketch the hyperbola.
Plan
Name a, h, k
Graph asymptotes
Solve for any intercepts
Graph intercepts
Sketch hyperbola
Implement
Intercepts:
no y-intercept
Explain
The hyperbola is a reflection because a = –1. The graph will shift up 3 spaces from the parent graph.
Note
You should use a, h, and k to describe the graph (written or verbal) before sketching so you know what to expect from the graph.
Example 7
Graph the asymptotes and intercepts. Sketch the hyperbola.
Intercepts:
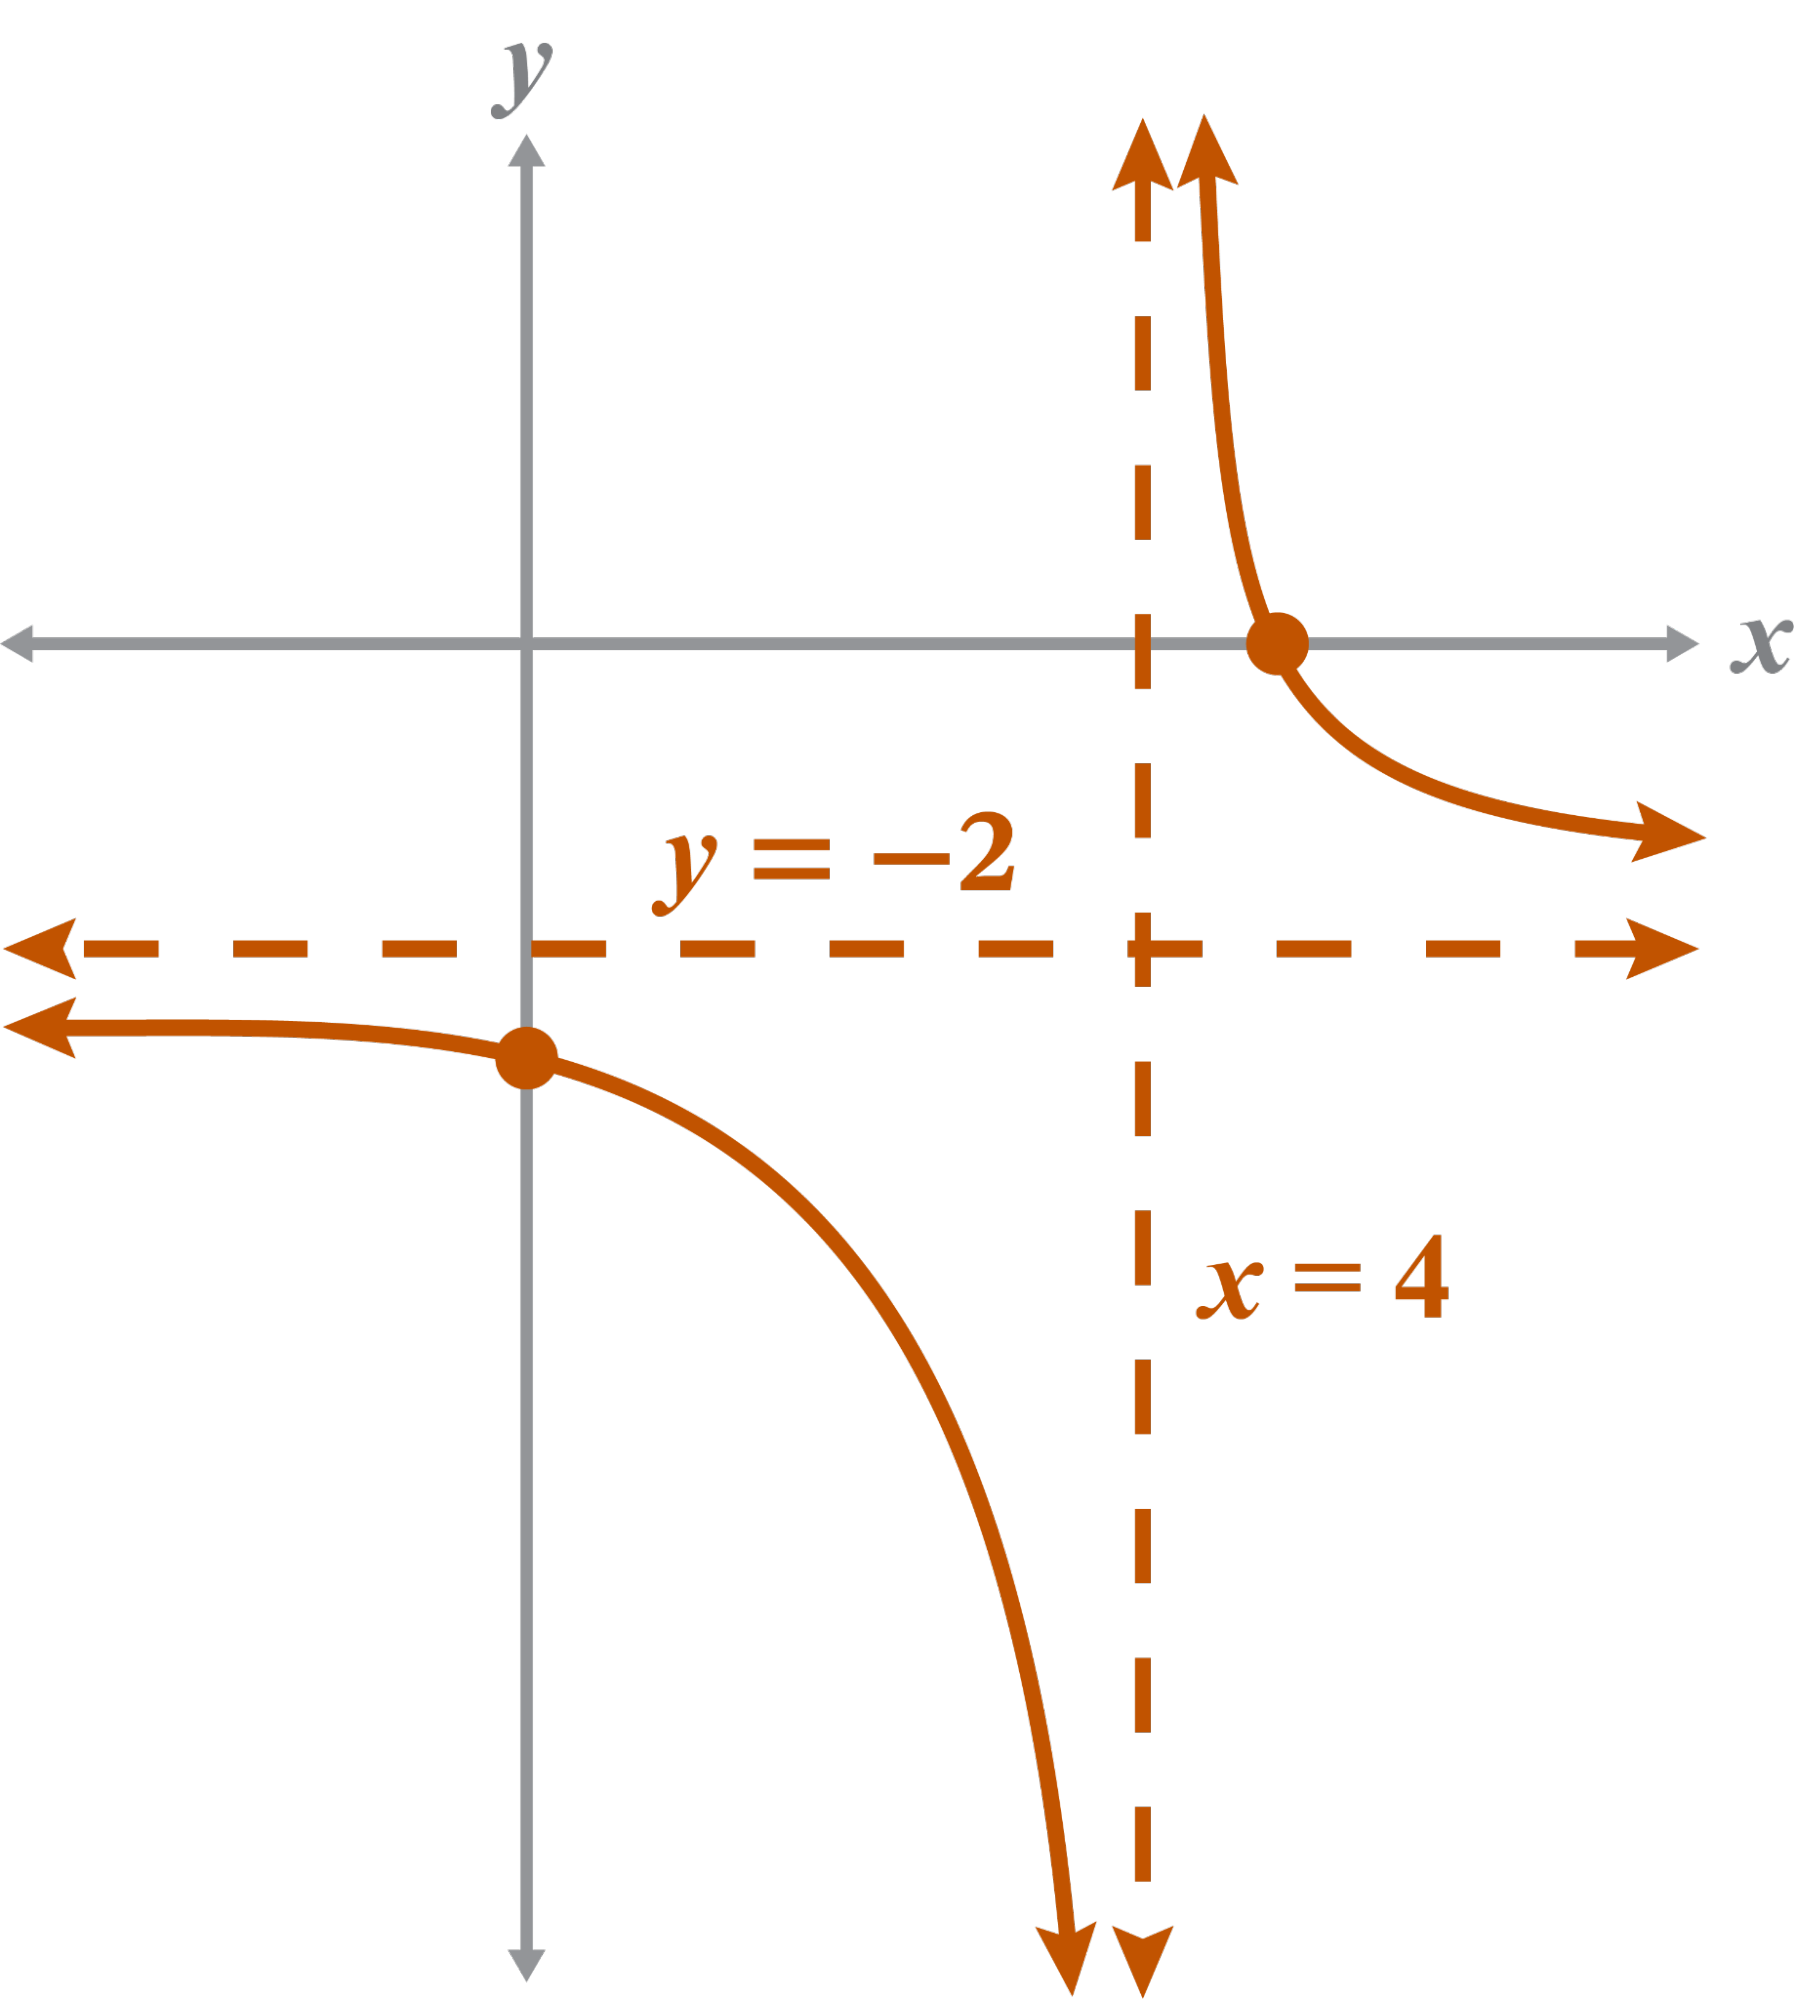
The hyperbola stretched, making it farther away from the asymptotes when a = 2. The values of h and k shift the function right 4, and down 2.
Example 8
Graph the asymptotes and intercepts. Sketch the hyperbola.
Intercepts:
no x-intercept

The hyperbola is closer to the asymptotes since the value of a is between 0 and 1. The graph shifts right one space.