
Mastery Check Solutions
Show What You Know
The scientists measured the wingspans in centimeters of two groups of Monarch butterflies in different parts of the world.
Pennsylvania, USA
mean: 9.5, median: 9.5, mode: 9.5, 9.6
Michoacán, Mexico
mean: 9.1, median: 9.5, mode: 9.8
- Explain the type of distribution for each group.
The Pennsylvania data is normal because the .
The Mexico data is left-skewed because .
Note
Q: When the data is skewed, where is the “tail” in the sketch?
A: The tail is on the left for left-skewed data and on the right for right-skewed data.
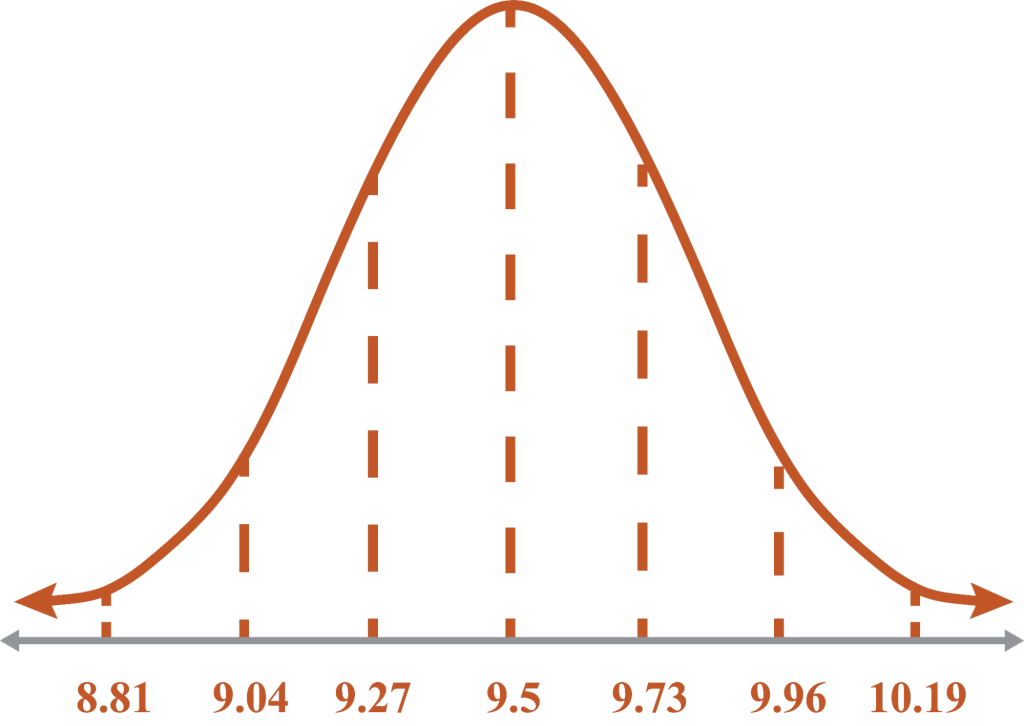
- The average wingspan of a Pennsylvania Monarch butterfly is 9.5 cm with a standard deviation of 0.23. Sketch the normal curve. Name the intervals for the Empirical Rule.
- Scientists measured the wingspan of eight Monarch butterflies found on a plant in Florida, USA. Calculate the mean and standard deviation.
Note
Technology can be used to calculate the mean and standard deviation.
Q: To what decimal place should the data be rounded? Explain.
A: To the hundredths, because that is one more decimal place than the numbers in the data set.
- What is the interval for 99.7% of Florida Monarchs? Explain if they vary more than the Pennsylvania butterflies.
The Florida (FL) Monarchs vary more than the Pennsylvania butterflies because the FL standard deviation is larger and the interval is larger.
Note
Remember to refer to part B for the intervals of PA Monarch butterflies.
Say What You Know
In your own words, talk about what you have learned using the objectives for this lesson and your work on this page.
Note
Restate the objectives of the lesson in your own words. If you are unable to restate the lesson objectives, go back and reread the objectives and then explain them.
- Describe a data distribution.
- Calculate standard deviation (for a population).
- Analyze normal distributions with the Empirical Rule.