Box Plots divide data sets into four parts, each with the same number of elements.
Note
Box Plots are sometimes called Box and Whisker Plots.
Box Plots allow us to visualize measures of spread and the five-number summary .
Five-Number Summary:
A quartile is a quarter of the data set.
The minimum value of the data set is the smallest number in the data set.
The lower quartile , Q1, is the median of the lower half of the data set; 25% of the data falls below it.
The median value of the data set is Q2.
The upper quartile , Q3, is the median of the upper half of the data; 25% of the data falls above it.
The maximum value of the data set is the largest number in the data set.
Measures of spread:
The interquartile range (IQR) represents the spread of the middle 50% of the data set and measures the spread based on the median value (Q2).
To find the interquartile range:
Range is found by subtracting the minimum value from the maximum value.
To construct a box plot, calculate the five-number summary :
Minimum, (min)
Lower quartile, Q1
Median, Q2
Upper quartile, Q3
Maximum, (max)
The median, Q2, is the middle number in the data set but is not always in the middle of the box when graphed.
In a box plot, the box represents the middle 50% of the data elements. The whiskers are drawn from the minimum to the first quartile and from the third quartile to the maximum.
Note
In some texts, the minimum is also referred to as Q0 as it represents the 0th percentile and the maximum is also referred to as Q4 or the 100th percentile. Q1, can be referred to as the first quartile and Q3 can be referred to as the third quartile.
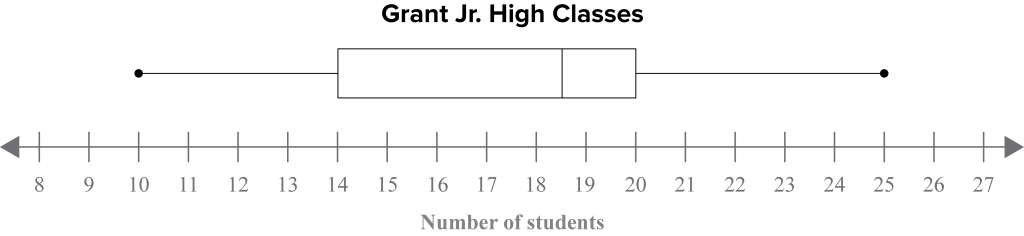
Example 1
Determine the five-number summary, interquartile range, and range from a box plot.
Example 2
Calculate the five-number summary, interquartile range, and range.
Brianna calculated the temperature at 8:00 am every morning for ten days. Her results in degrees Celsius: .
Plan:
Write the data set in order.
Calculate the median (Q2).
Calculate Q1.
Calculate Q3.
Determine the min and max.
Calculate the IQR and Range.
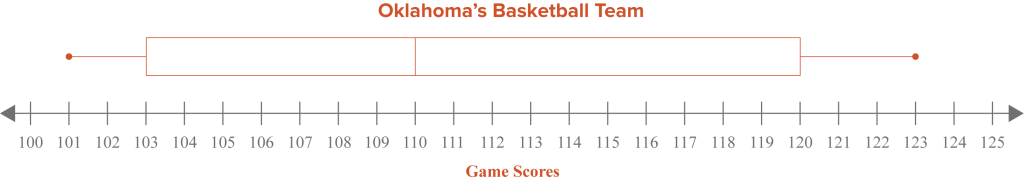
Example 3
Construct a box plot.
Oklahoma’s Basketball Team won a championship in seven games. Their final score in each game was: .