
Explore
Dots Plots Solutions
Measures of center:
- Mean is the average.
- Median is the middle element of the data set when the data set is ordered.
- Mode is the most frequently occurring element in the data set.
Measure of spread:
- Range is the maximum value of the data set minus the minimum value.
Note
Dot plots can sometimes be called line plots.
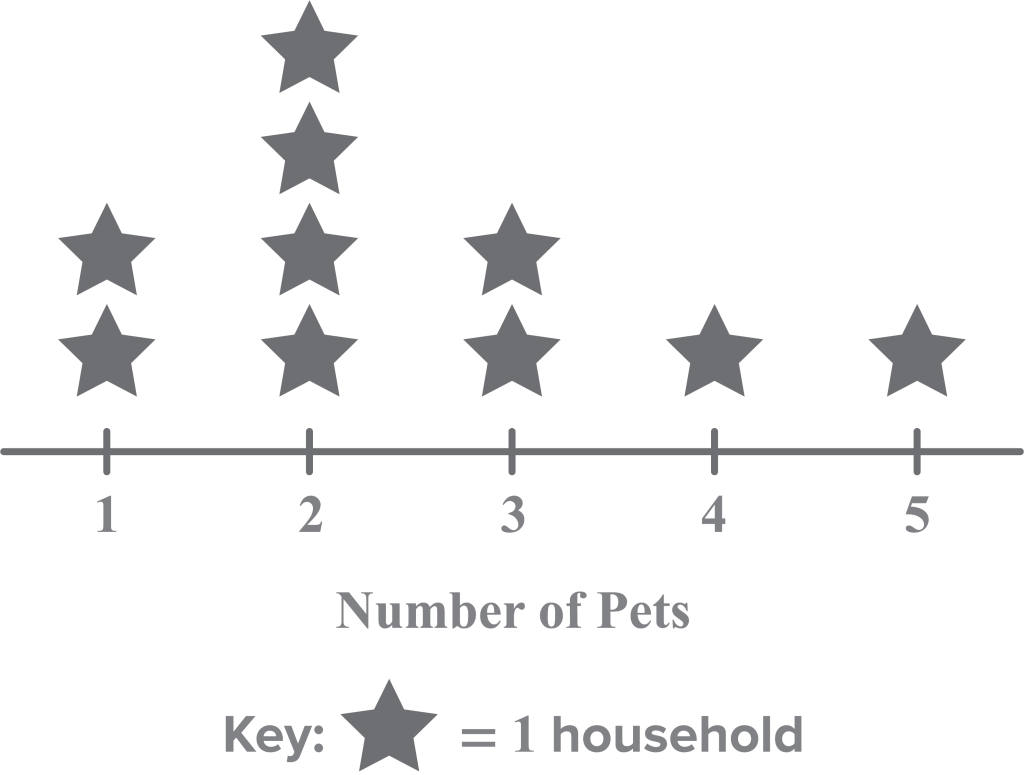
Example 1
Determine the mean, median, mode, and range of the dot plot.
Mean:
The mean is 2.5 pets.
Median:
The median is two pets.
Mode:
The mode is two pets.
Range:
The range is four pets.
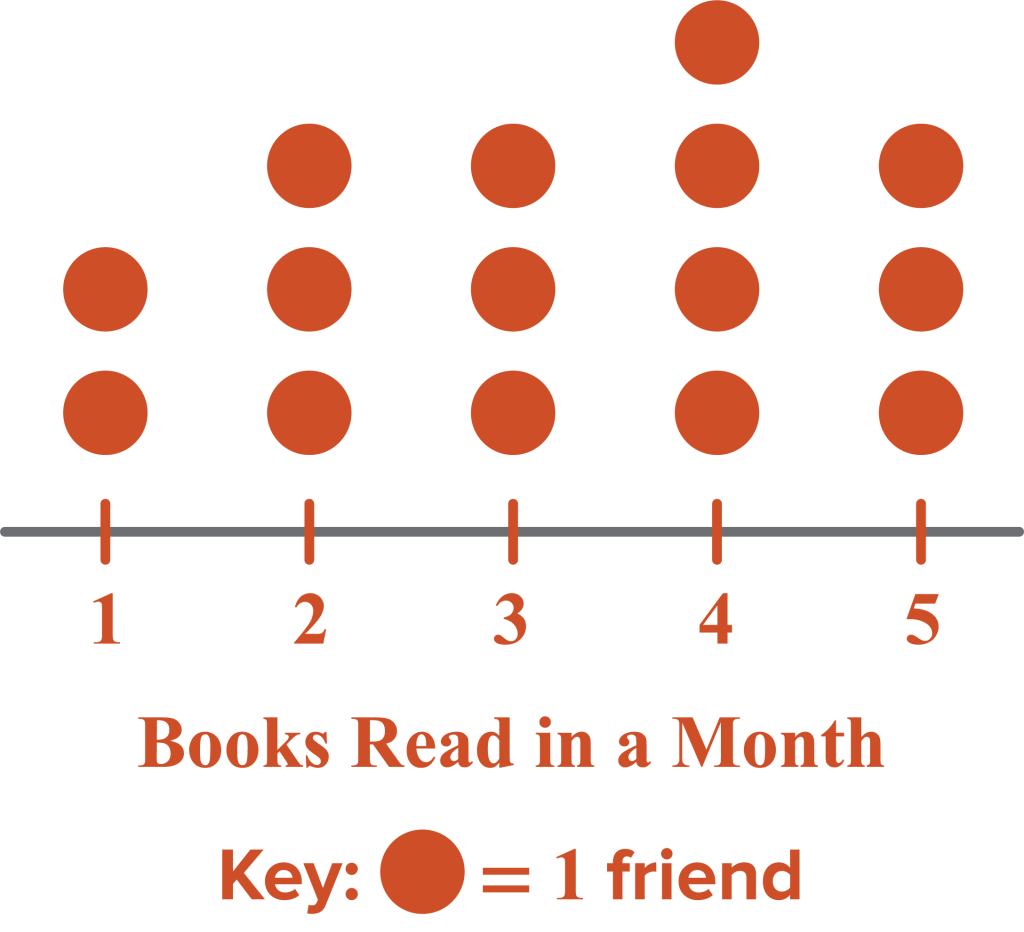
Example 2
Construct a dot plot.
Anna asked 15 friends how many books they read in a month. She was given the following results:
Example 3
Construct a dot plot. Determine the mean, median, mode, and range.
Mrs. Neill’s class collected cans for a food drive. Each student collected the following number of cans:
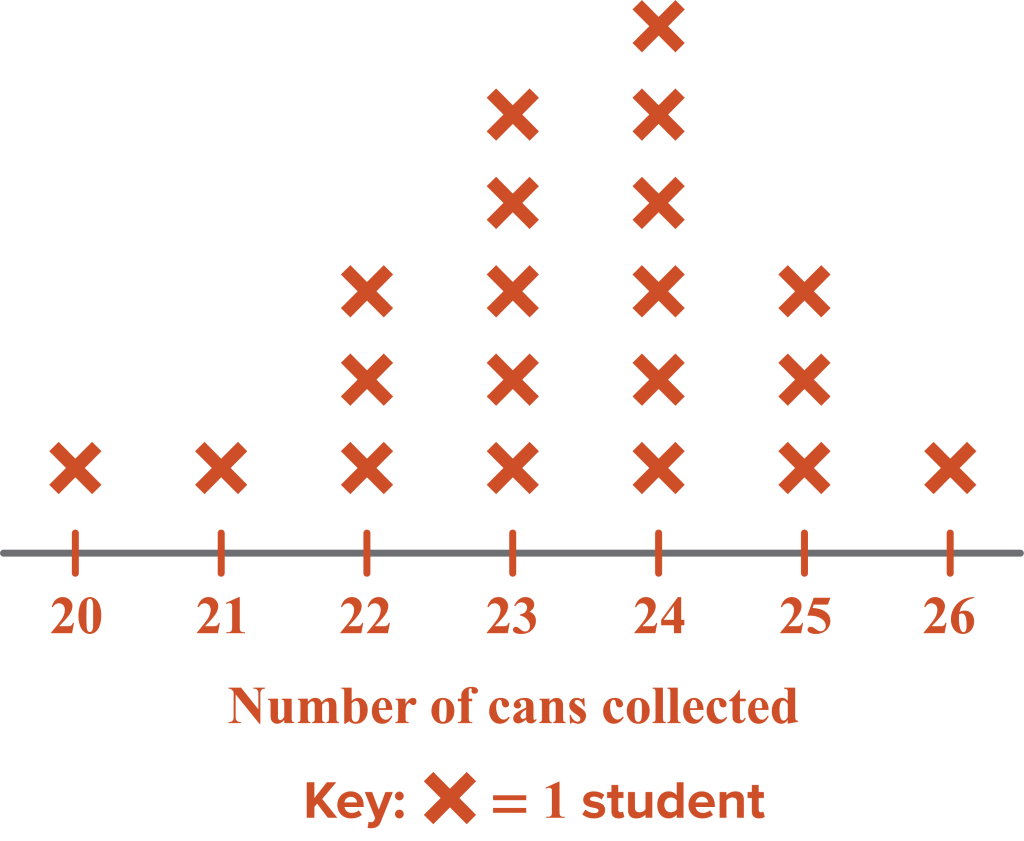
Mean:
The class collected an average of 23.35 cans per student.
Median:
The median is 23.5 cans.
Mode:
The mode is 24 cans.
Range:
The range is six cans.