
Explore
Patterns in Linear Scatter Plots Solutions
There are three types of correlation.
-
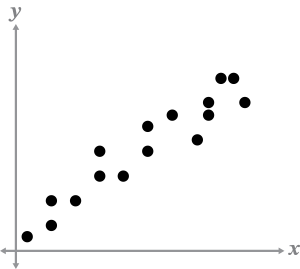
- Strong positive correlation:
-
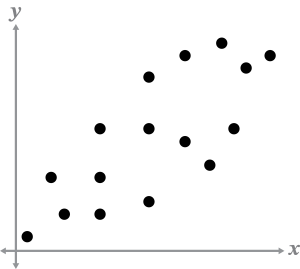
Weak positive correlation:
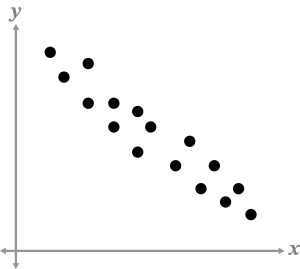
- Strong negative correlation:
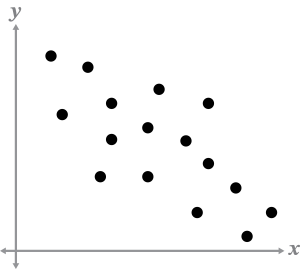
- Weak negative correlation:
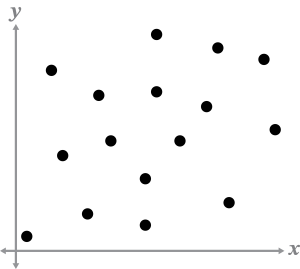
- No correlation: There is no relationship between the variables.
- Strong positive correlation:
Note
Recall that the independent variable is represented by the x-axis and the dependent variable is represented by the y-axis.
Example 1
Determine the correlation. Describe the correlation meaning in context.
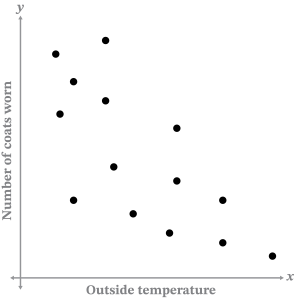
Weak negative correlation. As the outside temperature increases, the number of coats worn decreases.
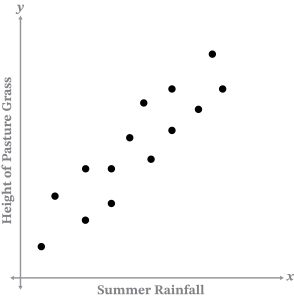
Strong positive correlation. As the amount of rain during the summer increases, the height of the pasture grass increases.
Example 2
Determine the correlation as positive, negative, or no correlation. Describe the correlation meaning in context.
- Length of hair and number of books read.
There is no correlation. The length of a person’s hair does not affect the number of books they read.
- Height and shoe size.
Positive correlation. As a person’s height increases, generally their shoe size increases.