The Horizontal Line Test Solutions
Note
A graph can still be made on a coordinate plane even when a function does not exist.
Example 4
For the given graph:
-
- Name the domain and range for the graph and its inverse.
- Explain whether or not the graph represents a function.
- If the graph is a function, determine if it is one-to-one.
- If the graph is a function, determine if the inverse is also a function.
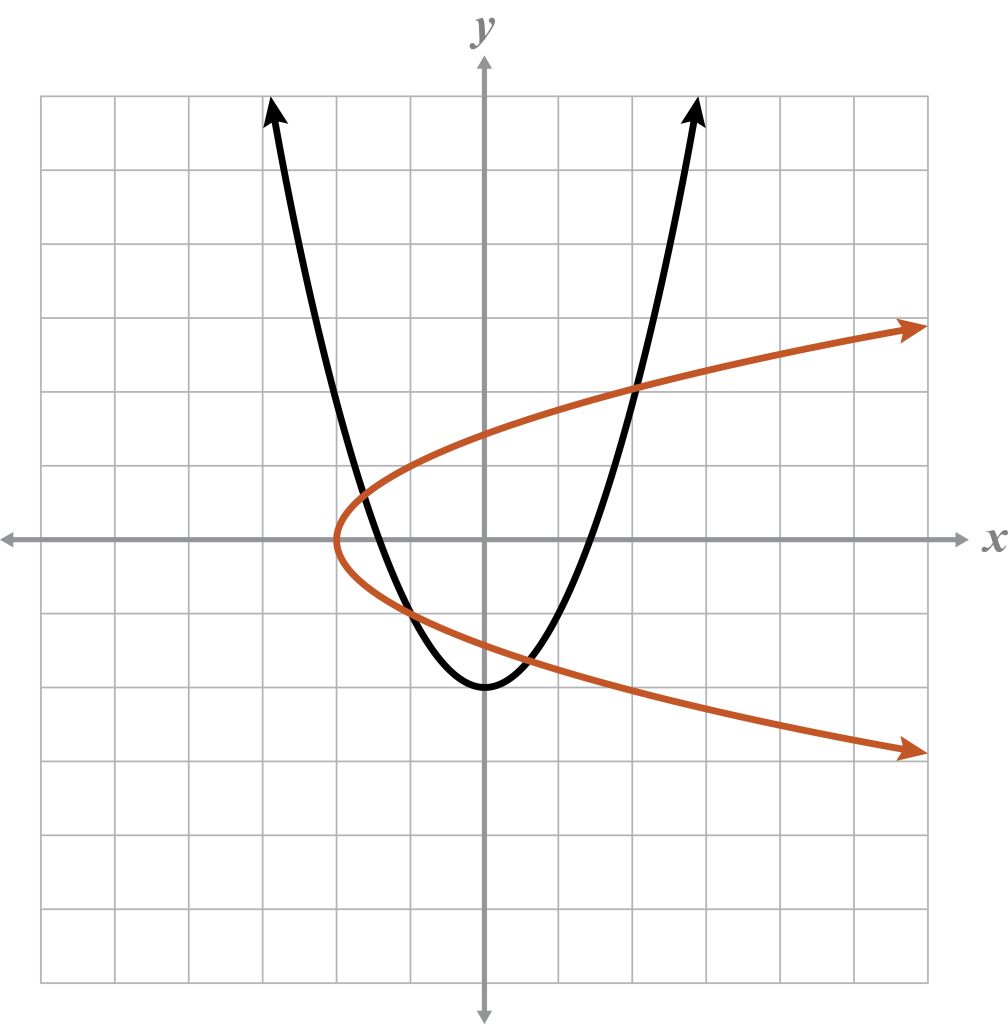
Given
Domain:
Range:
Inverse
Domain:
Range:
The parabola is a function because it passes the VLT. However, it is not one-to-one because it fails the HLT . This also means that the inverse is not a function .
Note
You can plot the inverse on the coordinate plane to help see if the inverse is a function using the VLT and determine the domain and range for the inverse if needed.
Example 5
For the given graph:
-
- Name the domain and range for the graph and its inverse.
- Explain whether or not the graph represents a function.
- If the graph is a function, determine if it is one-to-one.
- If the graph is a function, determine if the inverse is also a function.
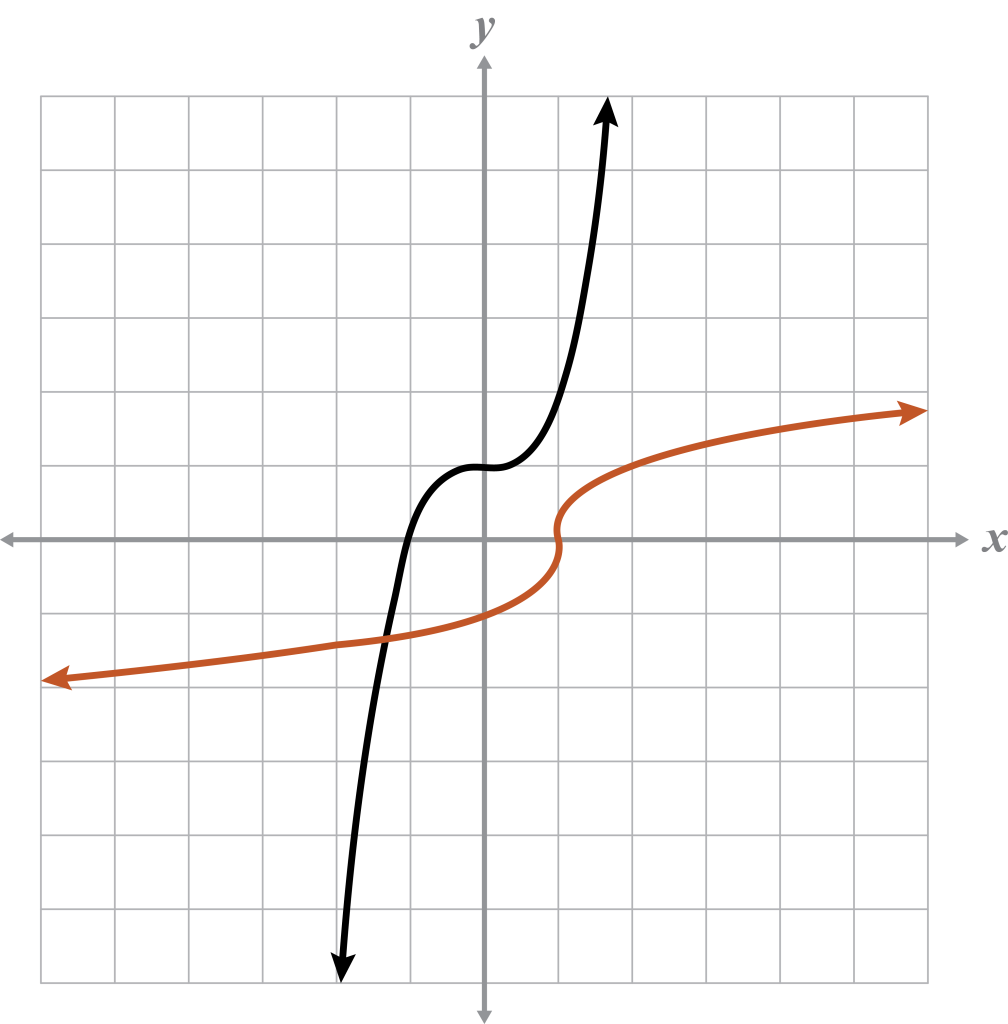
Given
Domain:
Range:
Inverse
Domain:
Range:
The (cubic) graph is a function because it passes the VLT. The graph also passes the HLT. This means that the given function is one-to-one, and its inverse is also a function.
Note
Naming the graph is good practice to retain recognition of equations graphically.
Example 6
For the given graph:
-
- Name the domain and range for the graph and its inverse.
- Explain whether or not the graph represents a function.
- If the graph is a function, determine if it is one-to-one.
- If the graph is a function, determine if the inverse is also a function.
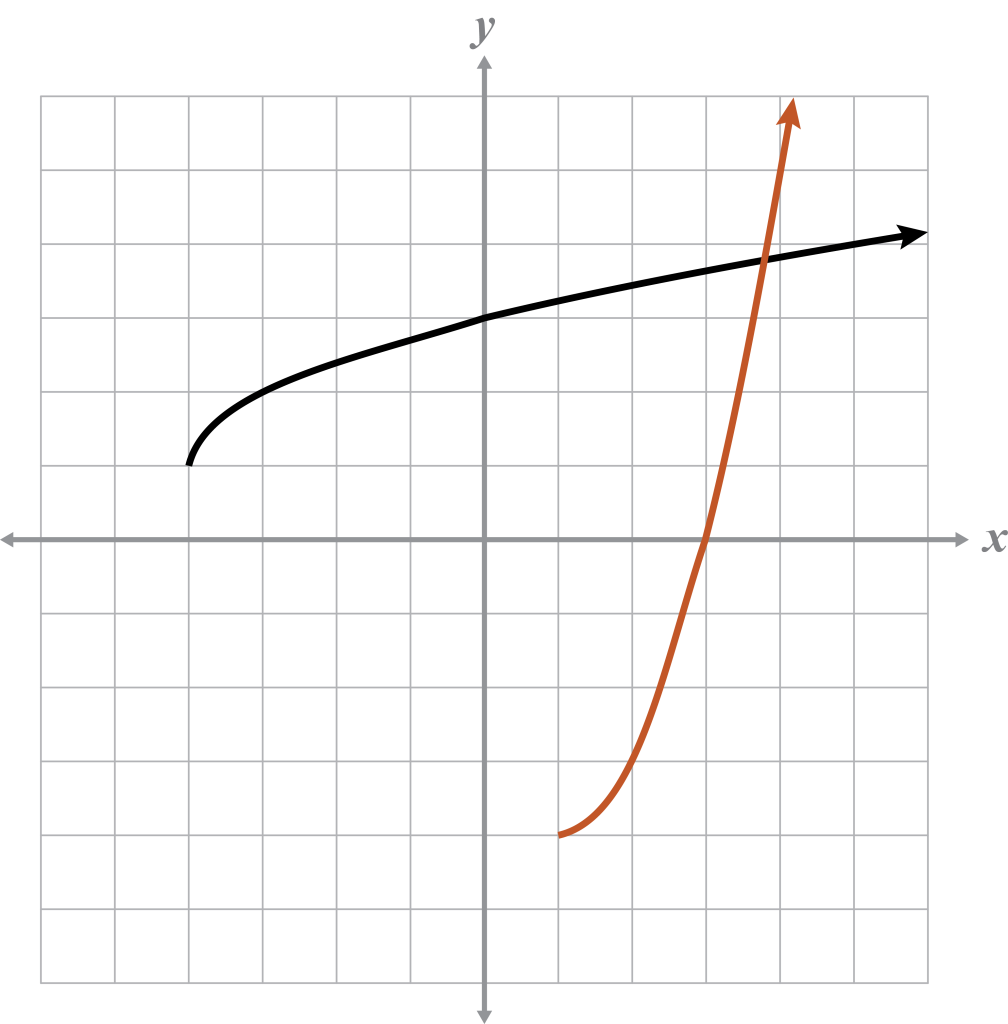
Given
Domain:
Range:
Inverse
Domain:
Range:
The (square root) graph is a function because it passes the VLT. The graph also passes the HLT. This means that the given function is one-to-one, and its inverse is also a function.