Explore
Graphing Functions and Their Inverses Solutions
- When the graph of a function is given, graph the inverse function by interchanging the domain and range values and plotting them on the coordinate plane.
- If the given function is defined as and graphed as (a, b), then the inverse function can be defined as and graphed as .
- When the inverse of a function is graphed it is reflected over the line y = x because the inverse of y = x is .
- The line of reflection , y = x, is used to confirm visually that the function and its inverse are correct on the coordinate plane. It is optional, and so can be drawn as a dashed line .
- Recall that the vertical line test (VLT) is a visual representation that determines if a graph on the coordinate plane is a function by running a vertical line across the graph.
- If the vertical line touches more than one point at a time, the graph is not a function.
- The VLT can also be used to determine if the inverse of the given function is a function .
Example 1
Graph the inverse on the coordinate plane.
Plan
Label the given points
Graph y = x (line of reflection)
Graph (b, a)
Connect the points
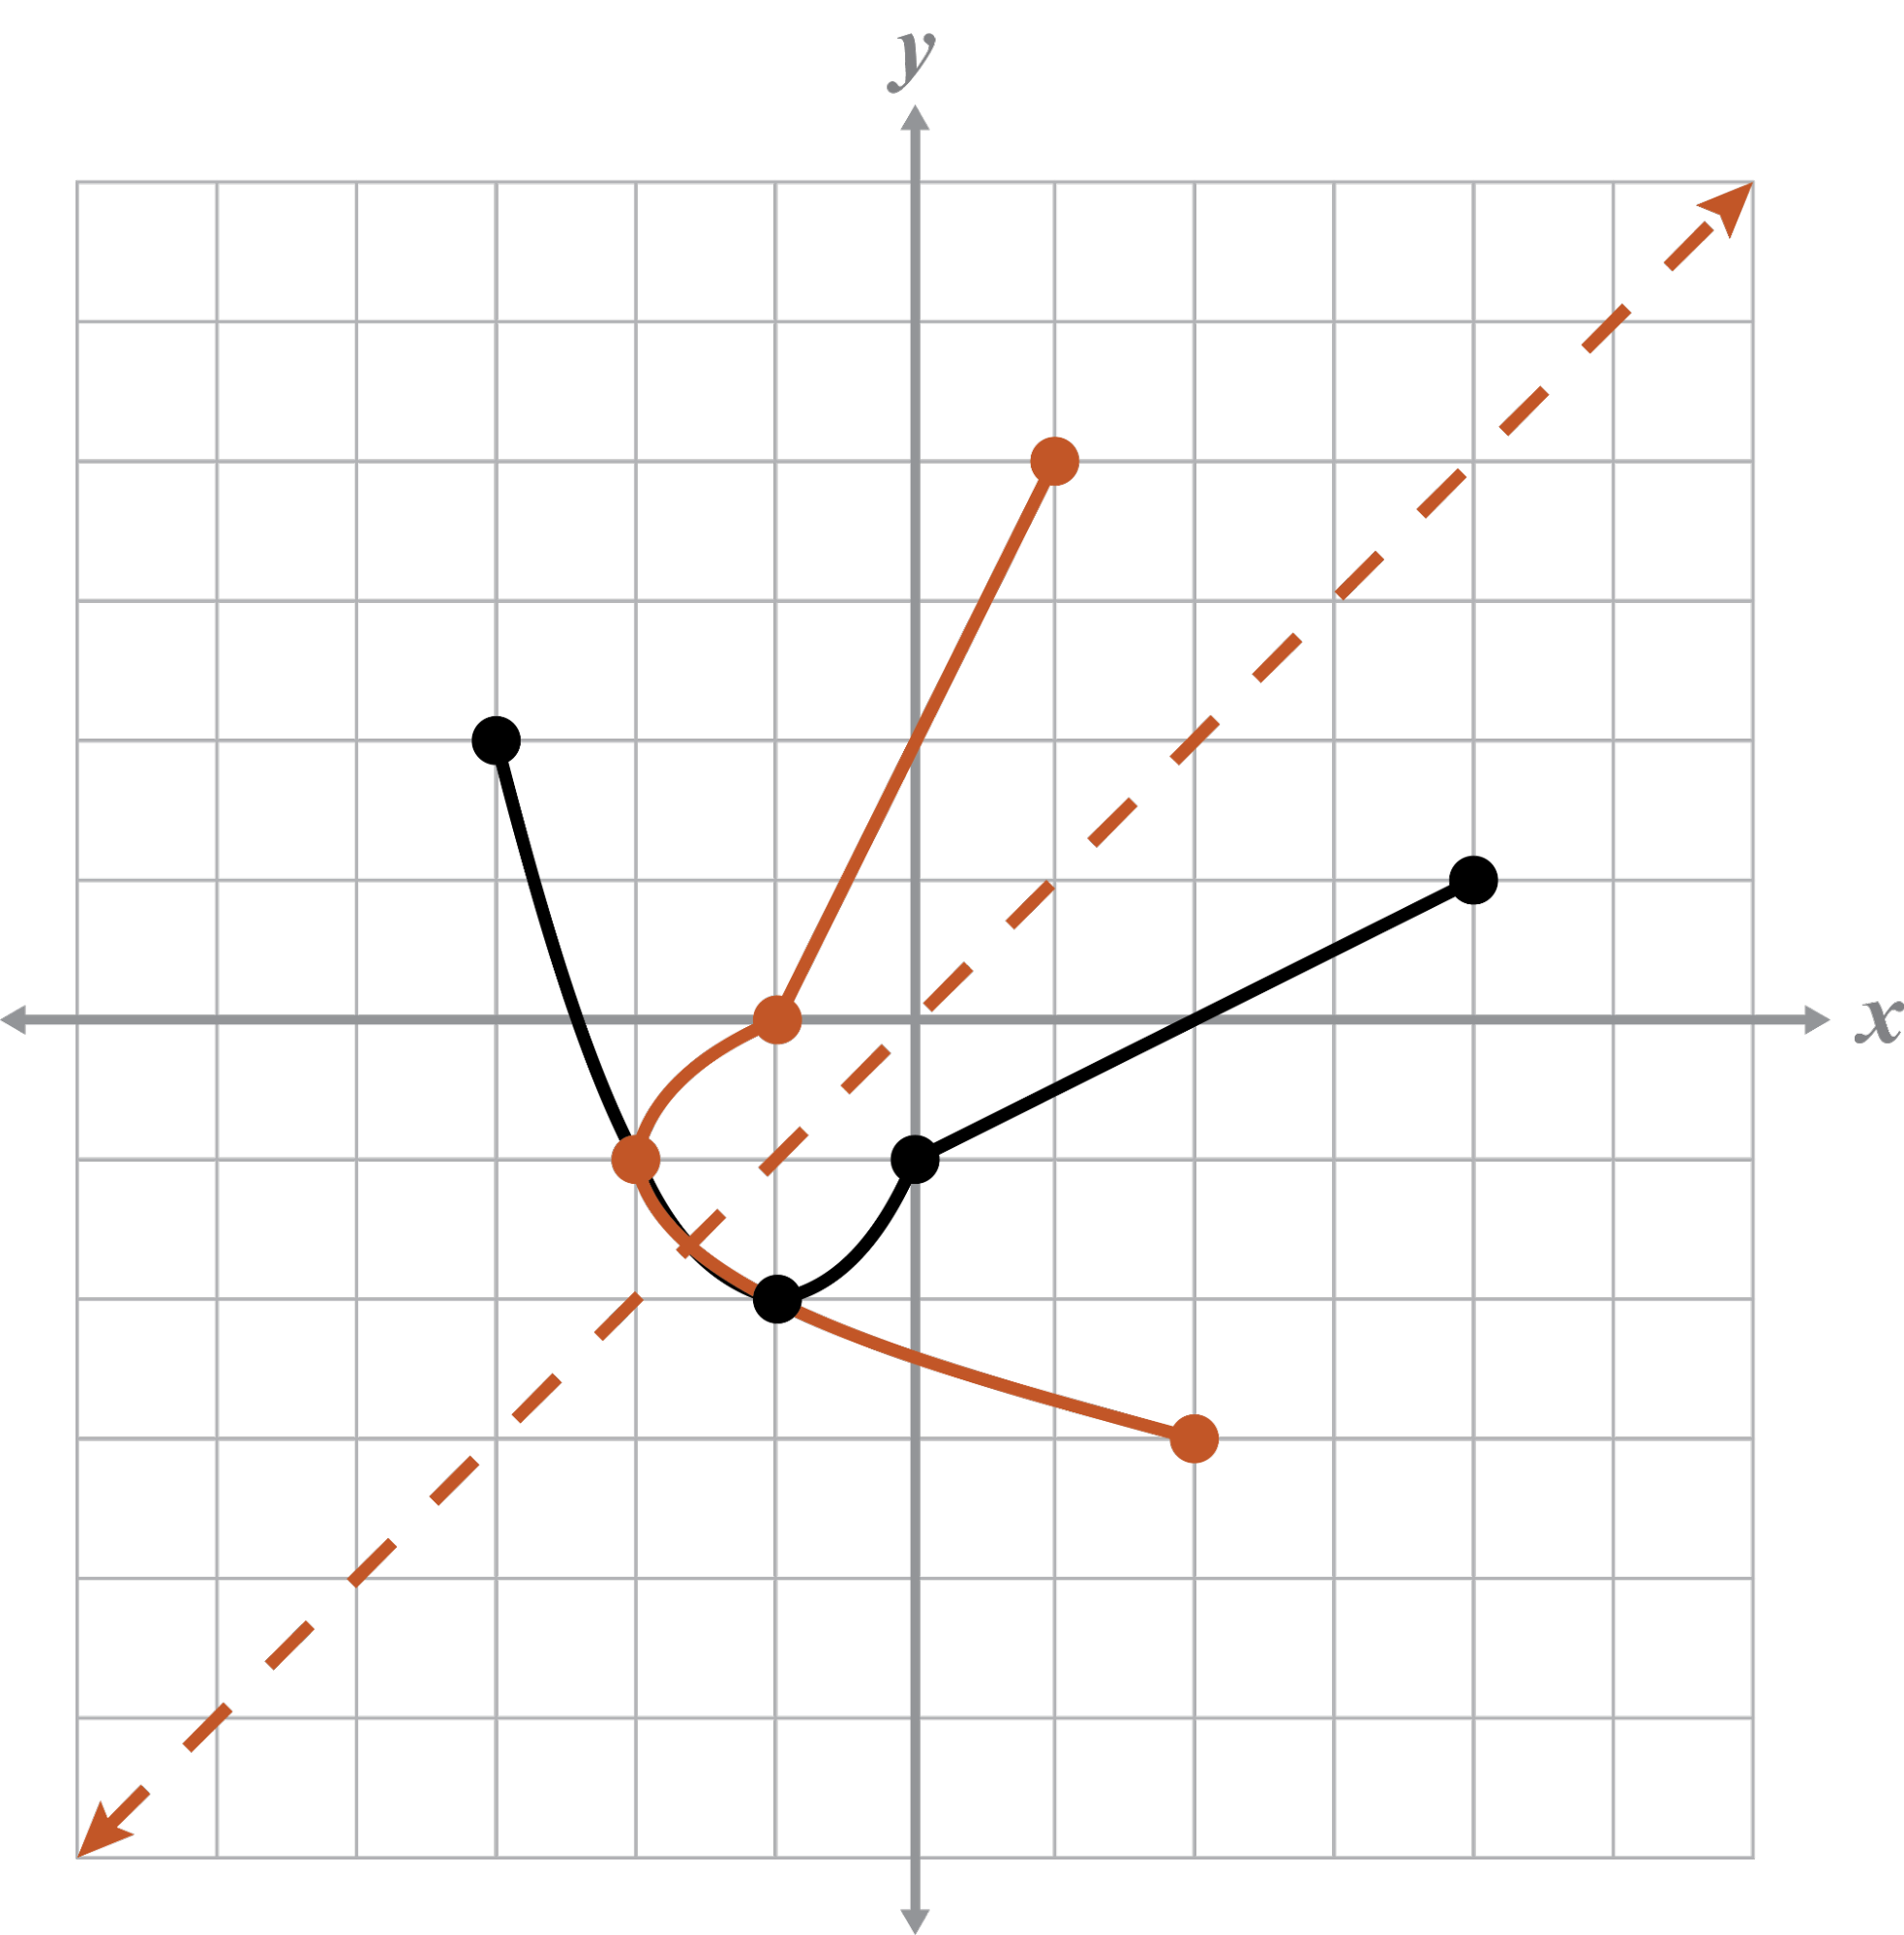
Example 2
Graph the inverse on the coordinate plane. Explain whether or not the graph and its inverse represent functions.
Plan
Label the given points
Graph y = x (line of reflection)
Graph (b, a)
Connect the points
Use VLT
The given graph is a function because it passes the VLT.
The inverse of the graph is not a function because it fails the VLT.
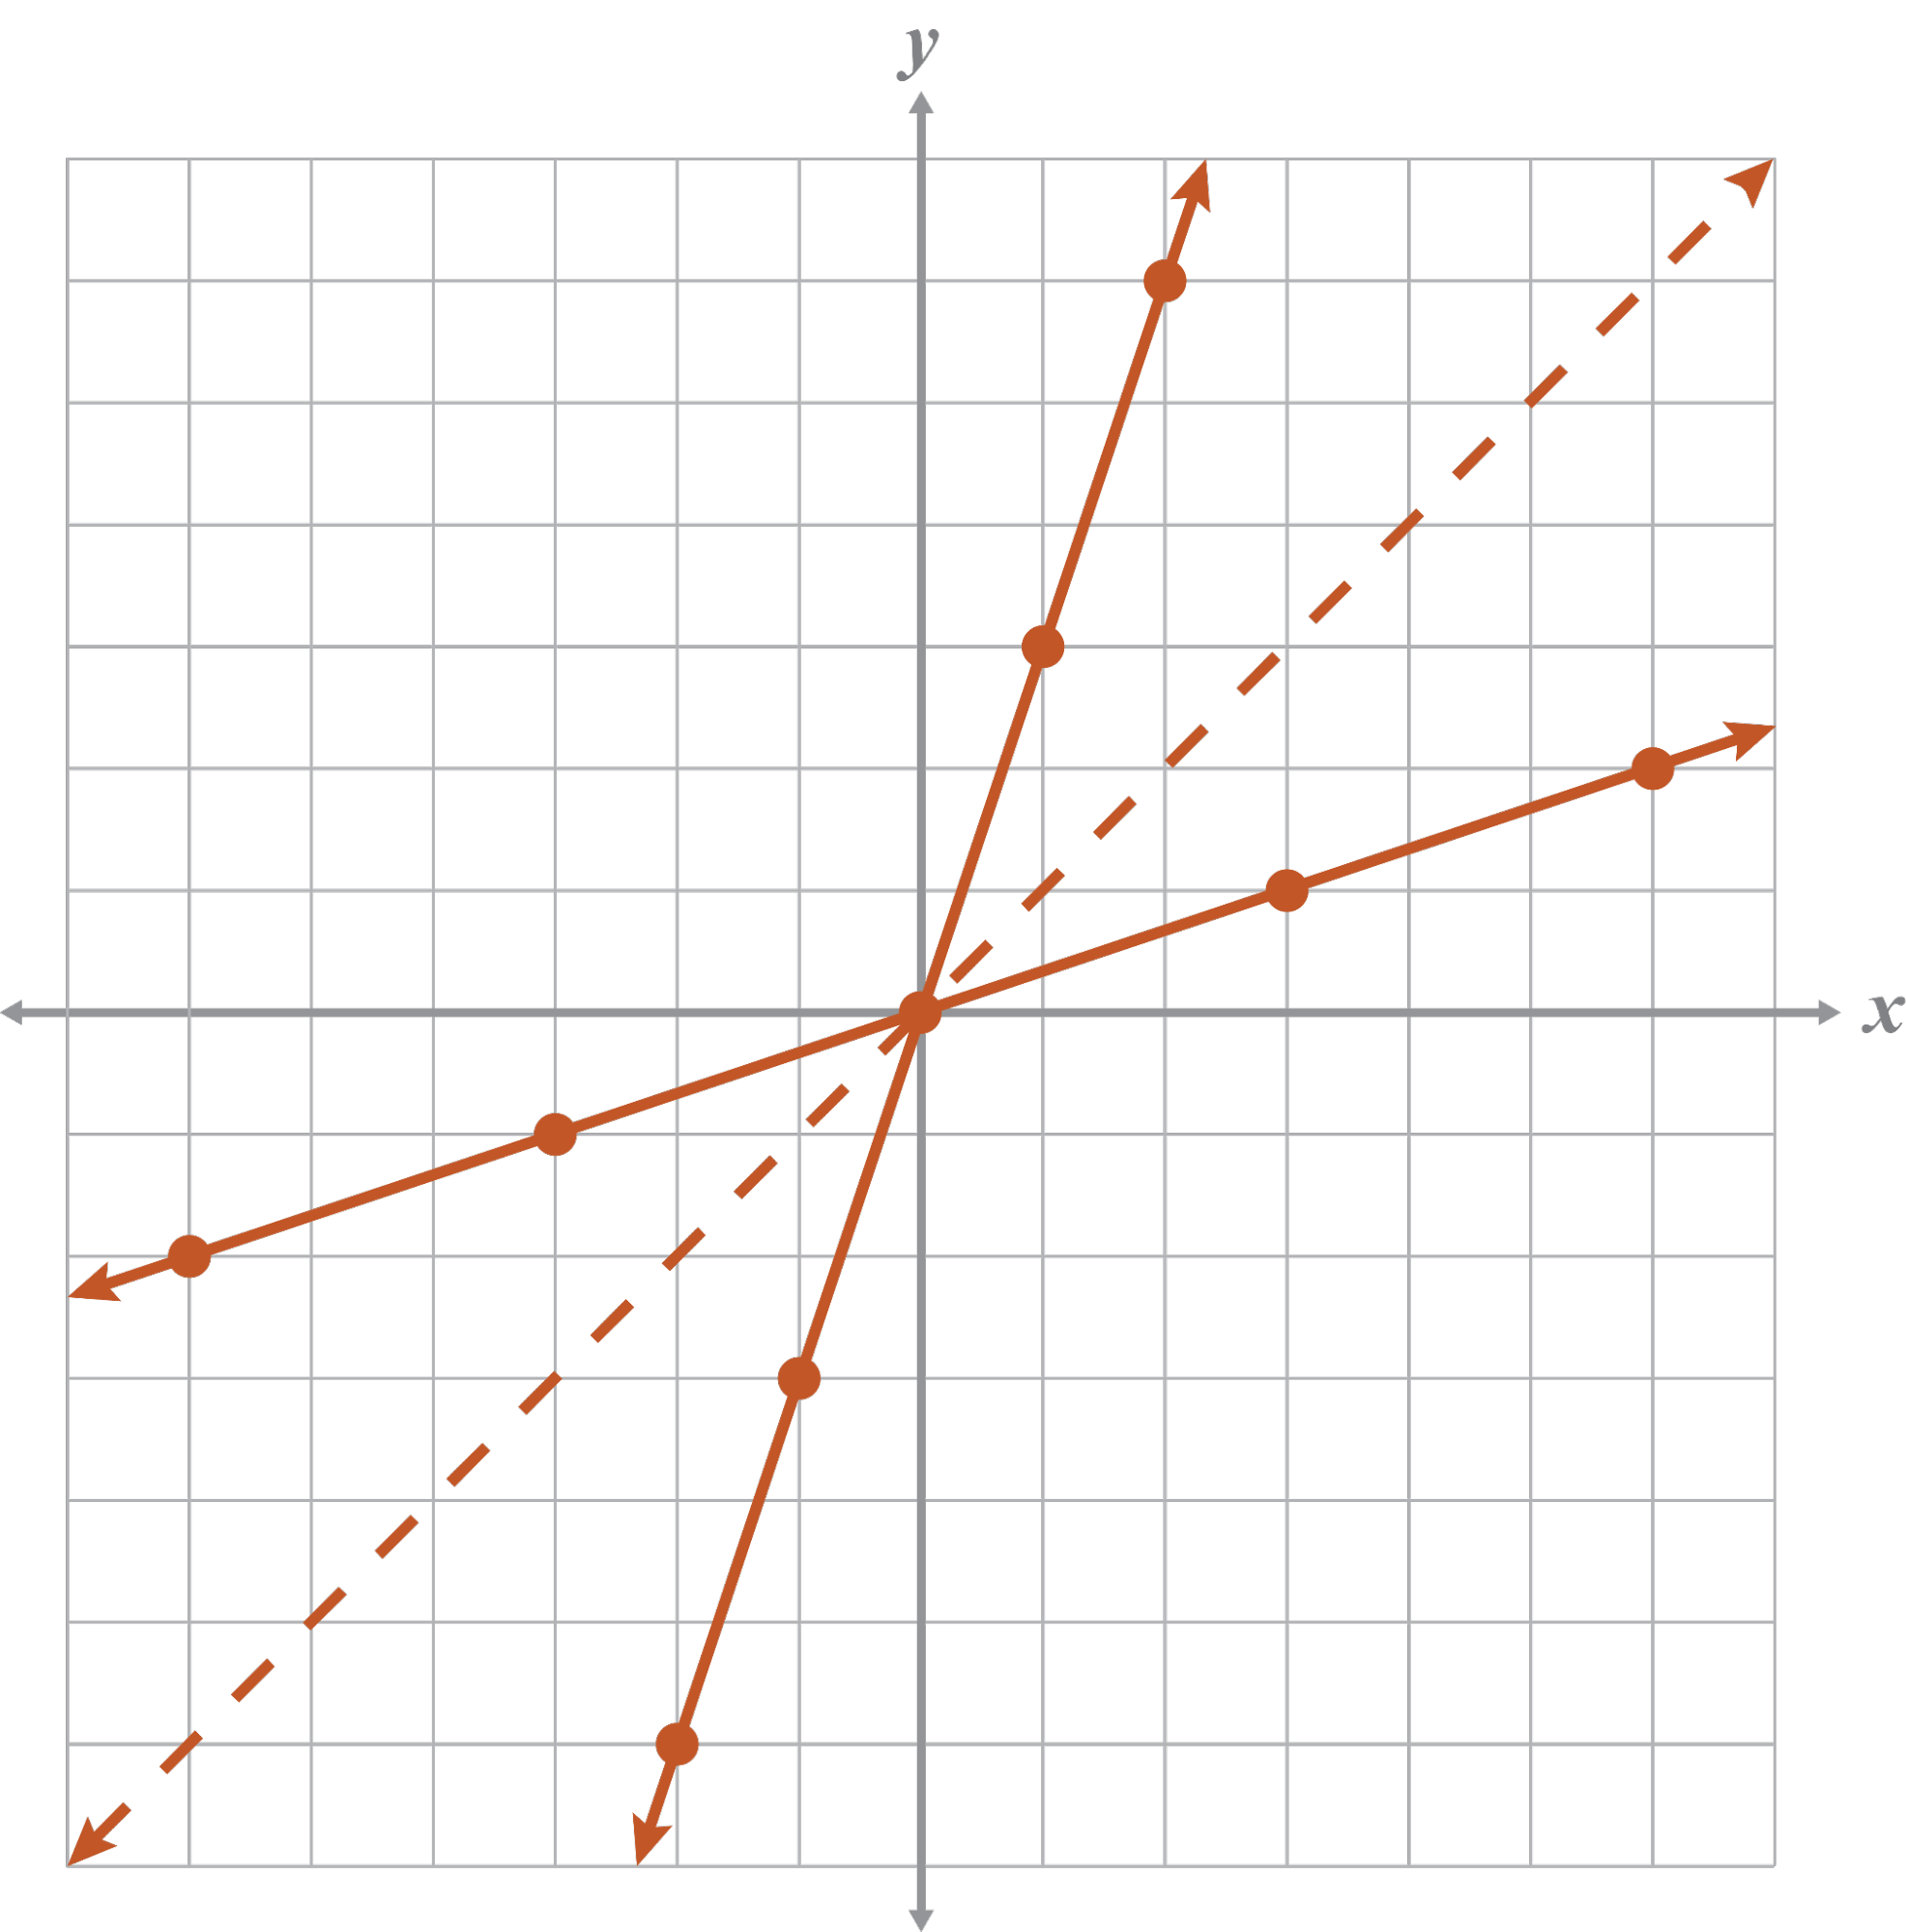
Example 3
Find the inverse of the function algebraically. Then graph the function and its inverse on the coordinate plane. Explain whether or not the graph and its inverse represent functions.
Bothand its inverse, y = 3x, are functions. They individually pass the VLT.
Note
The function and its inverse intersect at the origin. Remember that the VLT should only be used to check one graph at a time.