Graphing Linear Inequalities on the Coordinate Plane Solutions
- To graph a linear inequality on the coordinate plane, determine if:
- the line is solid or dashed .
- the shading will be above or below the line.
- Graph the y -intercept and slope and extend the line across the graph.
- When graphing a system of inequalities, repeat these steps until all inequalities are graphed on the coordinate plane.
- The shaded overlapping region region represents all ordered pairs that make every inequality in the system true .
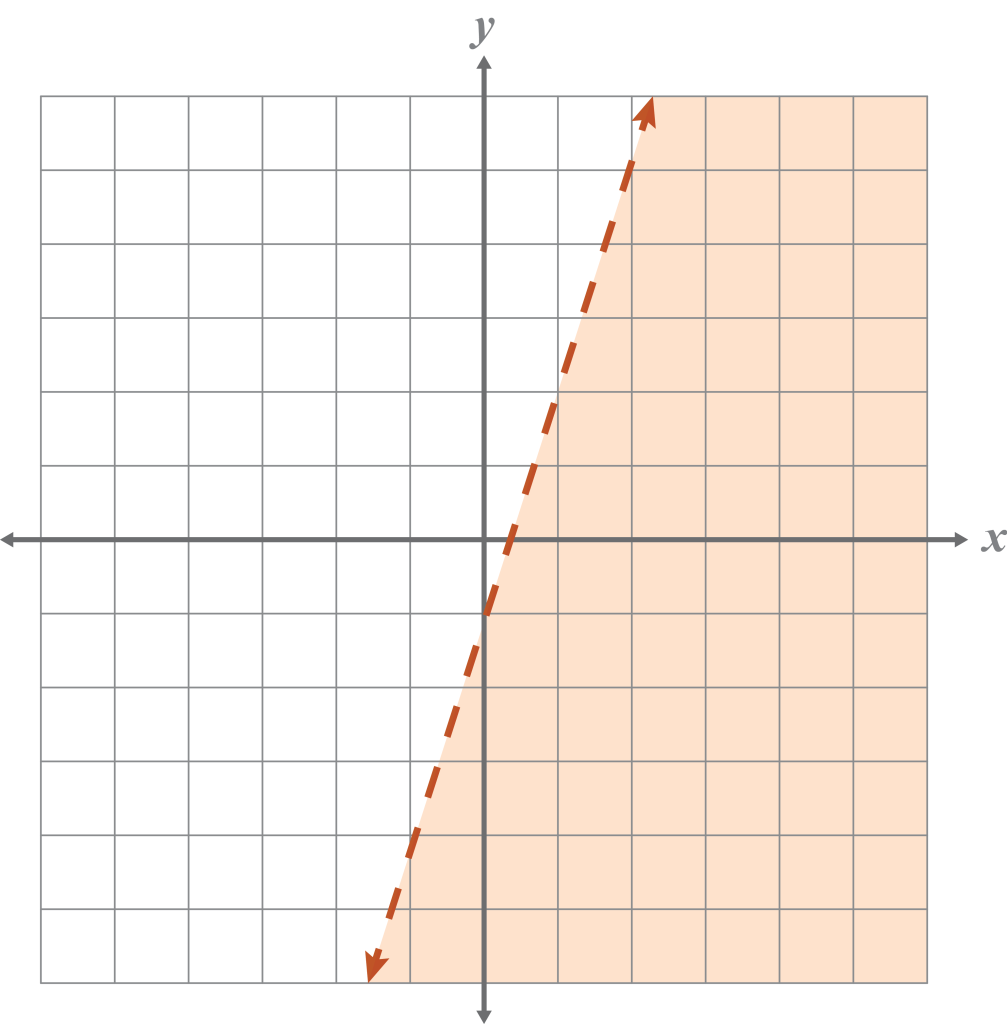
Example 1
Graph the linear inequality .
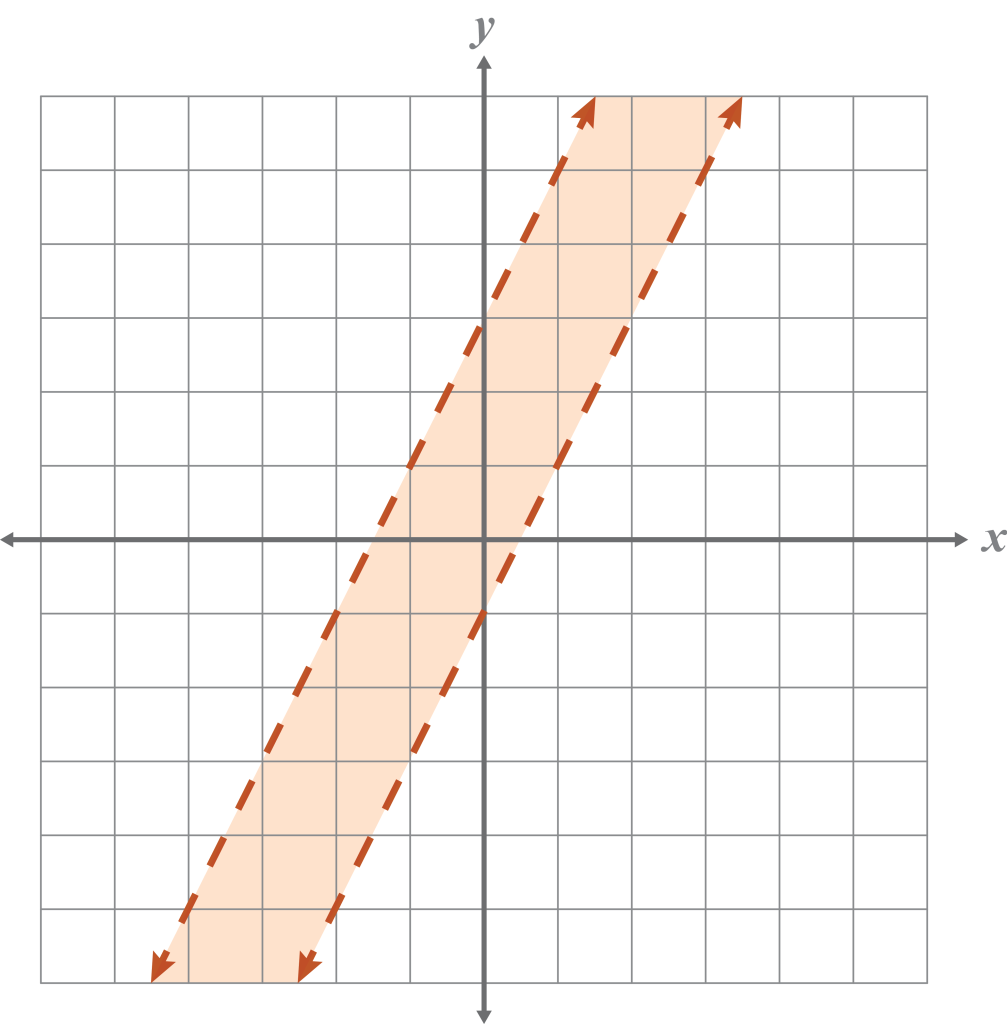
Example 2
Graph the system of inequalities.


